> ## Documentation Index
> Fetch the complete documentation index at: https://docs.formal.ai/llms.txt
> Use this file to discover all available pages before exploring further.
# Sessions
> Monitor and analyze user connections, queries, and activities in real-time
Sessions are logical groupings of logs sent during a user session - they're primarily a UI convenience to make your life easier. All the underlying data is still available in the Logs page, but sessions provide a more intuitive way to view and analyze user activities.
## What are Sessions?
Sessions represent active or completed connections between users and protected resources through Formal Connectors. Every database query, SSH command, API call, or Kubernetes exec is captured as part of a session, providing complete visibility into data access.
All non-HTTP traffic through a connector is associated with a **session.** Each TCP connection is an individual session. Sessions may be long-lived and have many **events** occur during the duration of the session.
Sessions are the foundation of Formal's audit trail and real-time monitoring capabilities.
## Session Events
Each session contains multiple event types that track the connection lifecycle:
* **`session-start`**: Emitted when a TCP connection is opened
* **`session-login`**: Occurs when a user successfully authenticates to a resource
* **`session-login-failed`**: Occurs when authentication fails
* **`session-end`**: Occurs when the TCP connection is closed
* **`session-analysis`**: For SSH and Kubernetes, analyzes the session to compute a risk score
Many more event types (such as `request`, `admin-policy-action`, and `stream-event`) can also occur within a session. These events are visible in [the Logs page](https://app.formal.ai/logs) for a session. Filter by `session.id` in [the Logs page](https://app.formal.ai/logs?q=session.id%3A*) to view all events that occur during a session.
## Session States
**Currently in progress** connections that you can monitor and terminate in
real-time. Active sessions show:
* **User identity and authentication method**
* **Connected resource and protocol**
* **Duration and start time**
* **Real-time query/command stream**
* **Evaluated policies and enforcement actions**
Active sessions have not had their `session-end` event occur yet.
**Finished connections** with full audit records for review and compliance.
Completed sessions provide:
* **Complete query/command history**
* **Session recordings (SSH, Kubernetes)**
* **Policy evaluation results**
* **Performance metrics**
* **Risk analysis and anomaly detection**
Completed sessions have a `session-end` event.
## Session Details by Protocol
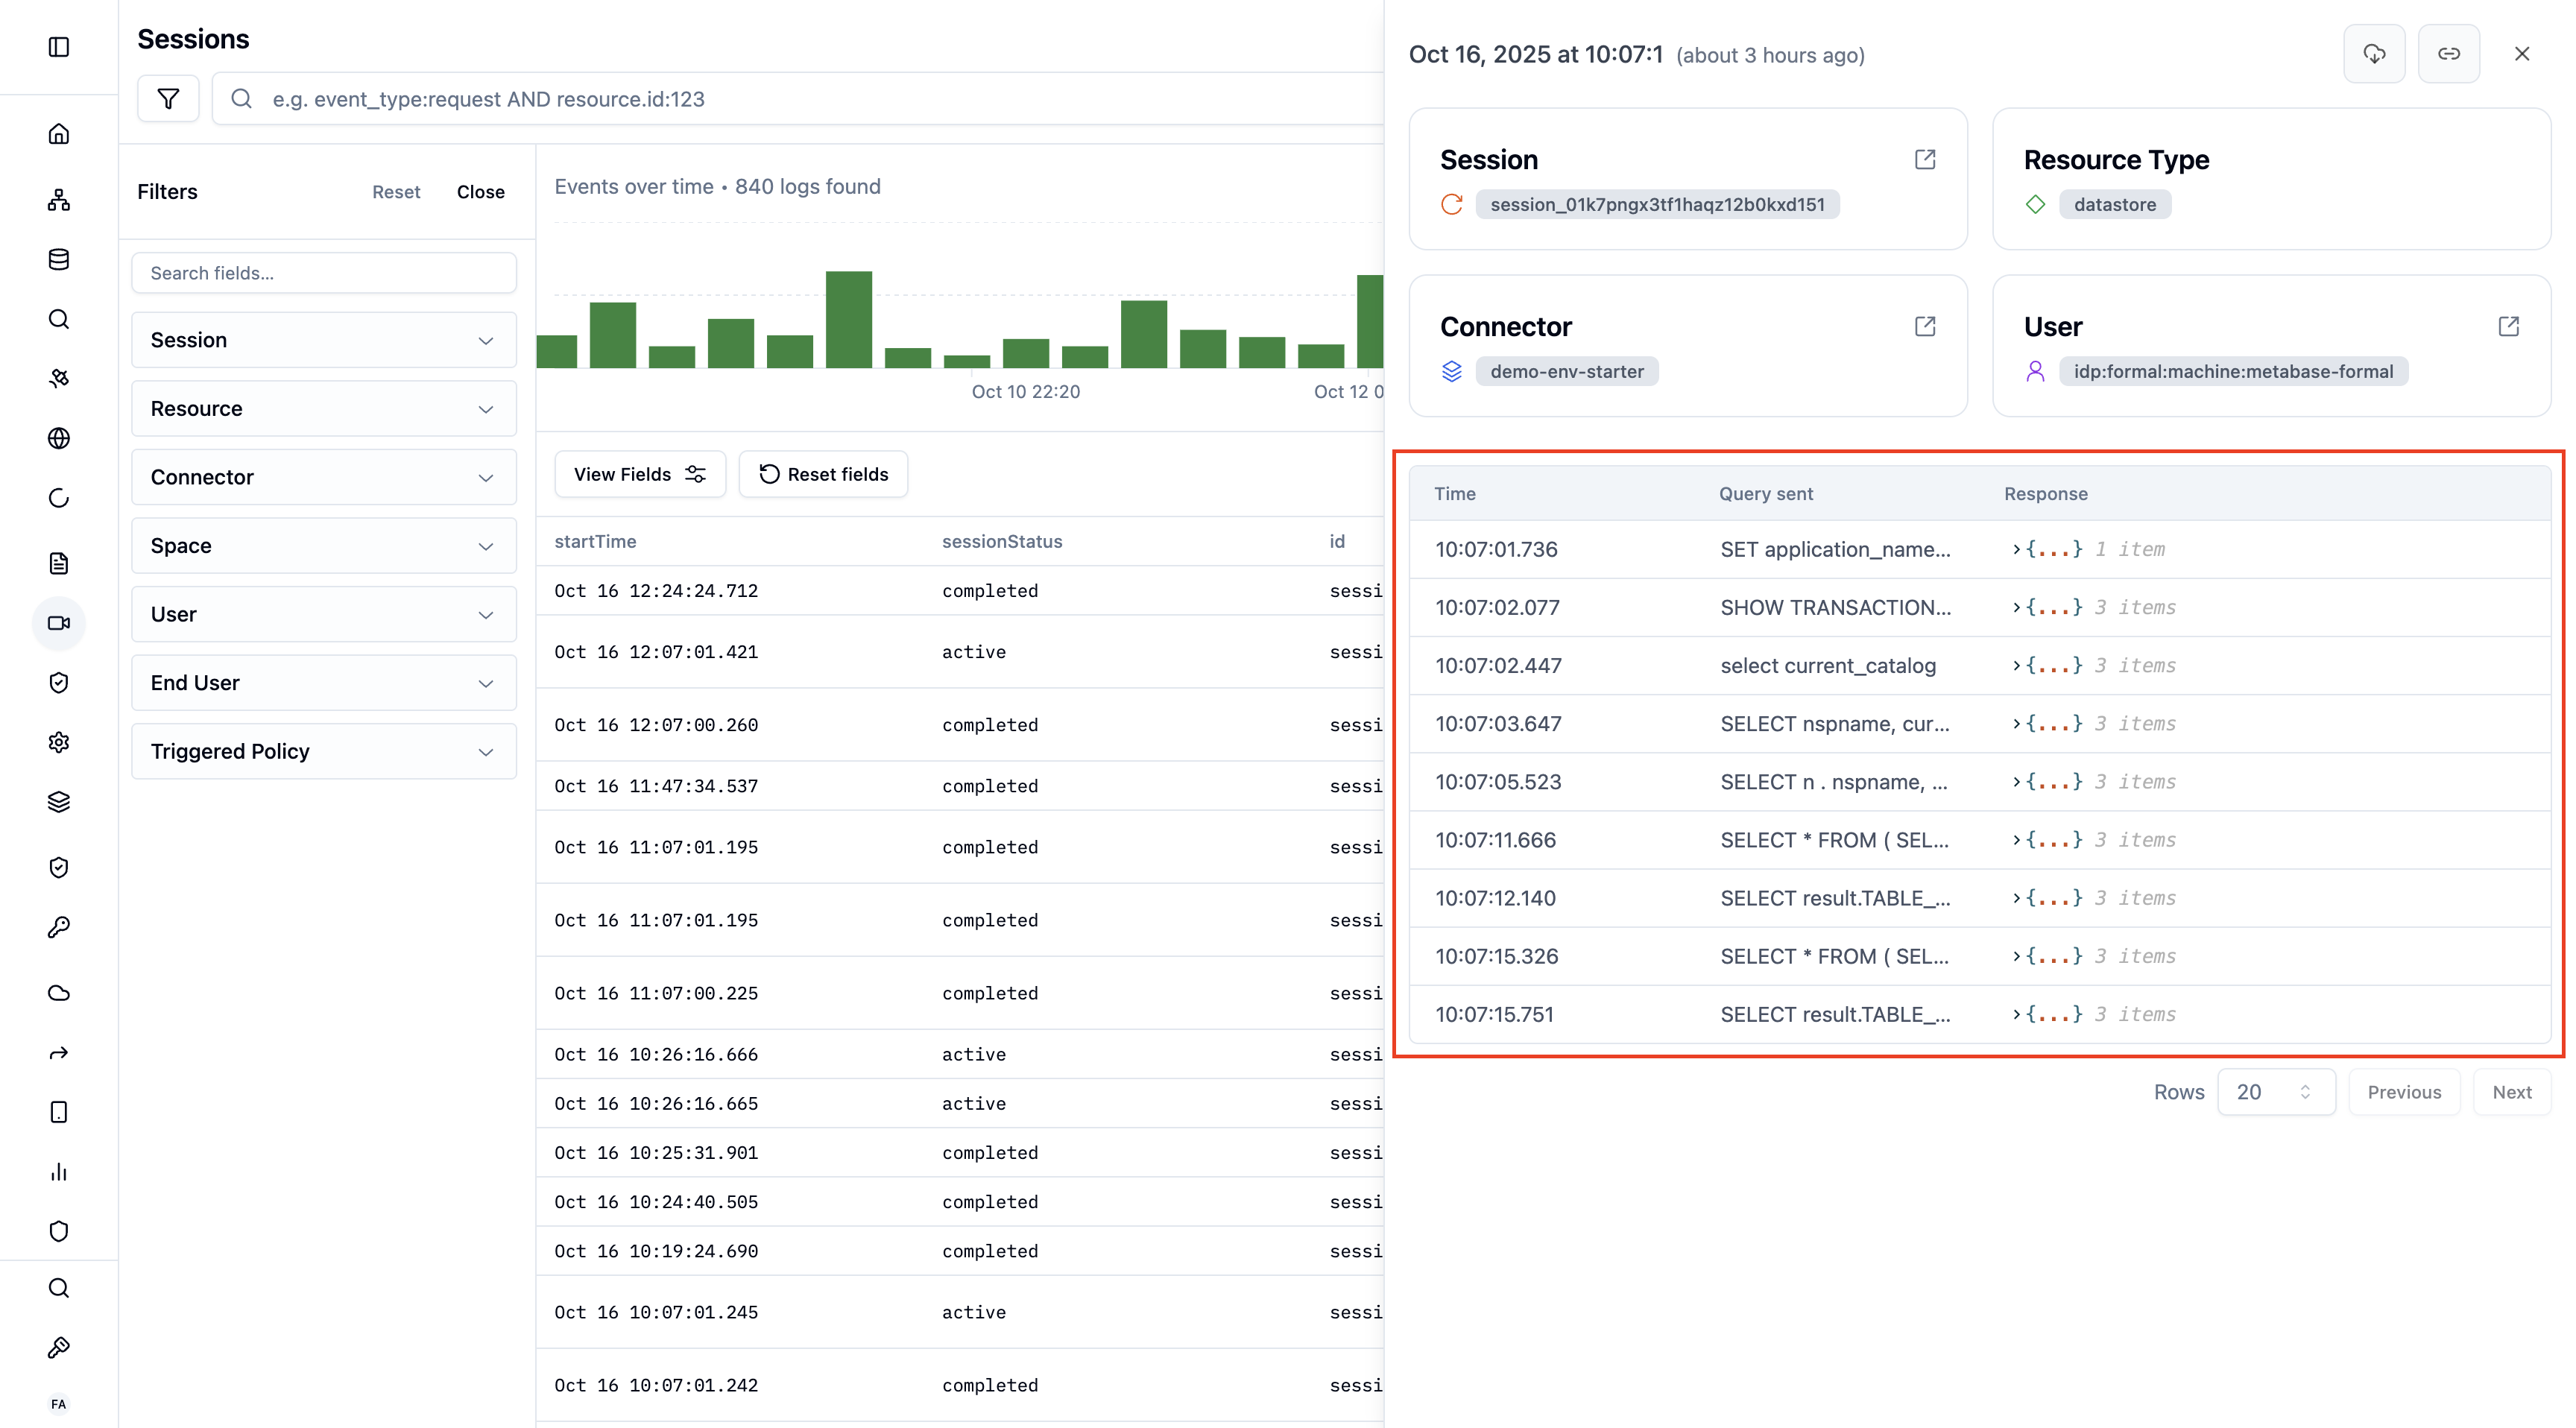
### Database Sessions (PostgreSQL, MySQL, MongoDB, etc.)
View all queries executed during a session:
* **Query text**: Full SQL/NoSQL command
* **Execution time**: Query duration
* **Rows affected**: Number of records touched
* **Policy actions**: Masking, denials, warnings
* **Parameters**: Bind variables and arguments
 ### SSH Sessions
Complete recordings of command-line interactions with pause, rewind, and fast-forward controls:
* **Full terminal recording**: Replay exactly what the user saw
* **Command extraction**: List of all executed commands
* **Risk scoring**: AI-powered analysis (1-5 risk level)
* **Session summary**: Natural language description of activities
### SSH Sessions
Complete recordings of command-line interactions with pause, rewind, and fast-forward controls:
* **Full terminal recording**: Replay exactly what the user saw
* **Command extraction**: List of all executed commands
* **Risk scoring**: AI-powered analysis (1-5 risk level)
* **Session summary**: Natural language description of activities
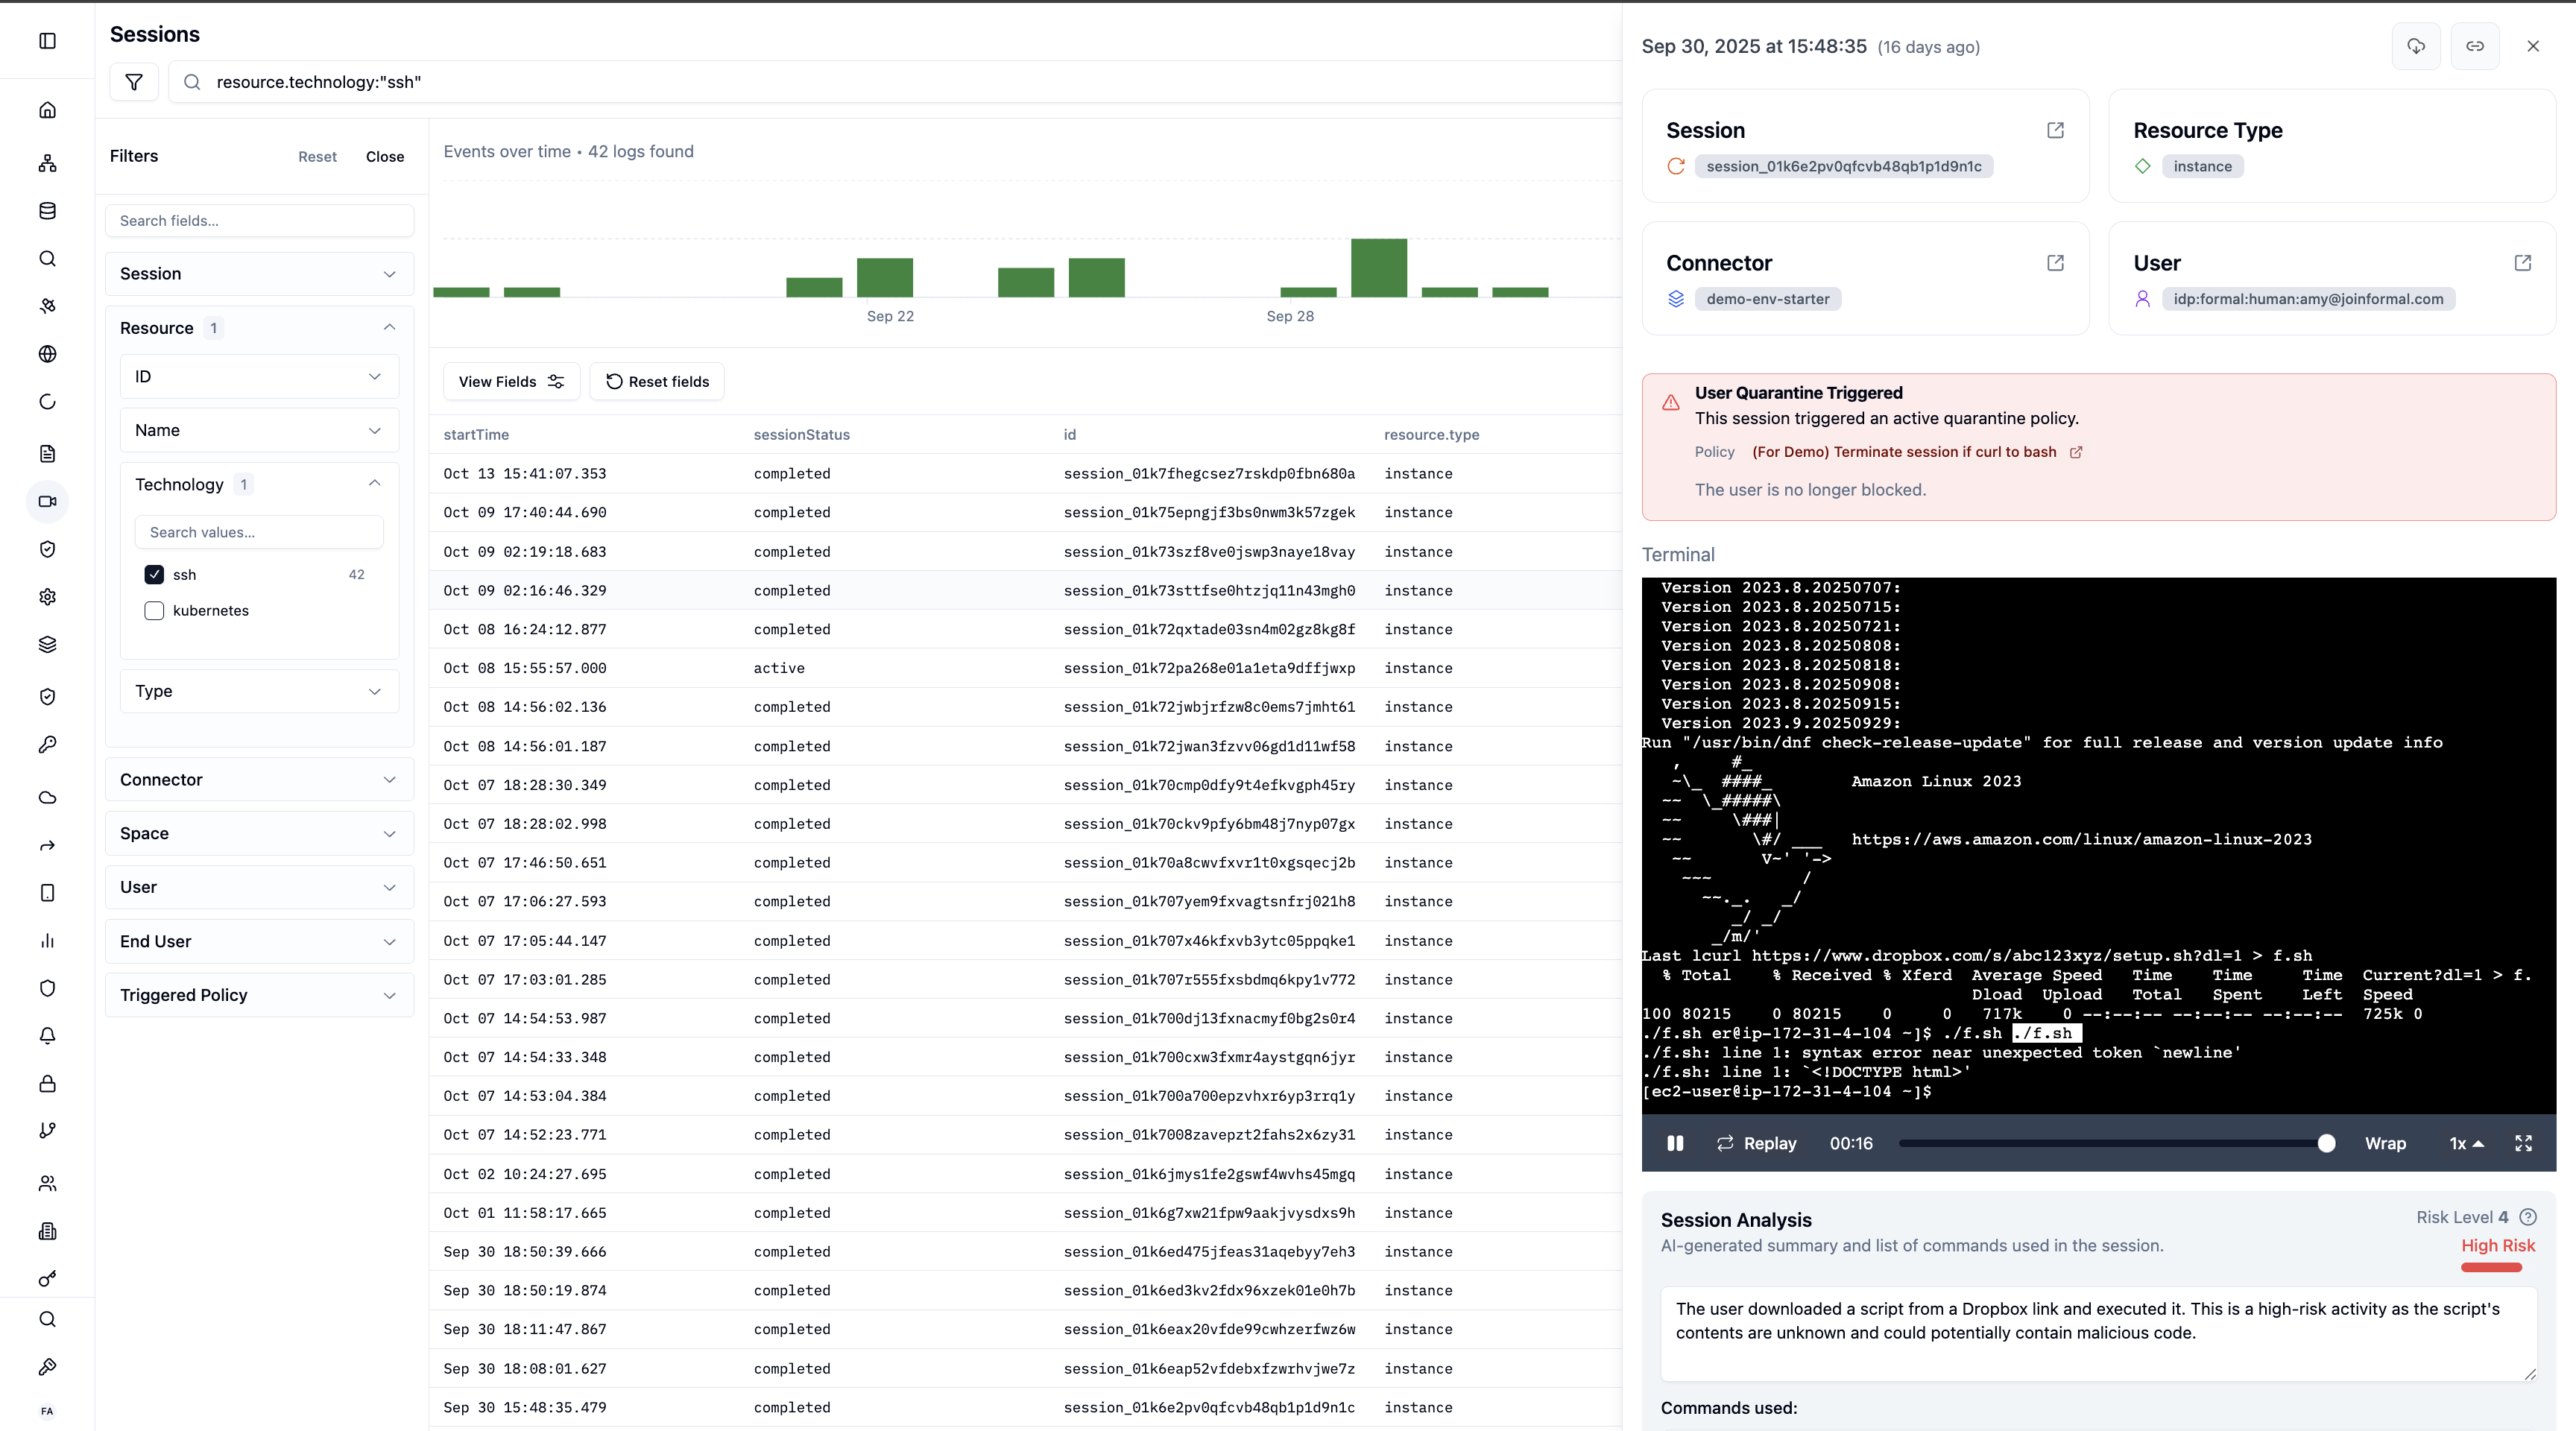 Risk level is determined by analyzing commands, file access patterns,
privilege escalation, and destructive actions. Level 5 indicates highest risk.
### Kubernetes Sessions (kubectl exec)
Records all `kubectl exec` interactions:
* **Pod and container**: Which pod was accessed
* **Commands executed**: Full command history
* **User identity**: Who initiated the exec session
* **Risk analysis**: Automated threat detection
### HTTP/API Sessions
Captures REST API calls and responses:
* **Request path and method**: GET /users, POST /api/data
* **Headers**: Authorization, content-type, custom headers
* **Request/response body**: Full payloads
* **Status codes**: 200, 401, 403, etc.
* **Policy enforcement**: Rate limiting, authentication, filtering
## Session Analysis
Formal can automatically analyze session recordings to provide insights:
Risk level is determined by analyzing commands, file access patterns,
privilege escalation, and destructive actions. Level 5 indicates highest risk.
### Kubernetes Sessions (kubectl exec)
Records all `kubectl exec` interactions:
* **Pod and container**: Which pod was accessed
* **Commands executed**: Full command history
* **User identity**: Who initiated the exec session
* **Risk analysis**: Automated threat detection
### HTTP/API Sessions
Captures REST API calls and responses:
* **Request path and method**: GET /users, POST /api/data
* **Headers**: Authorization, content-type, custom headers
* **Request/response body**: Full payloads
* **Status codes**: 200, 401, 403, etc.
* **Policy enforcement**: Rate limiting, authentication, filtering
## Session Analysis
Formal can automatically analyze session recordings to provide insights:
 ### AI-Powered Analysis
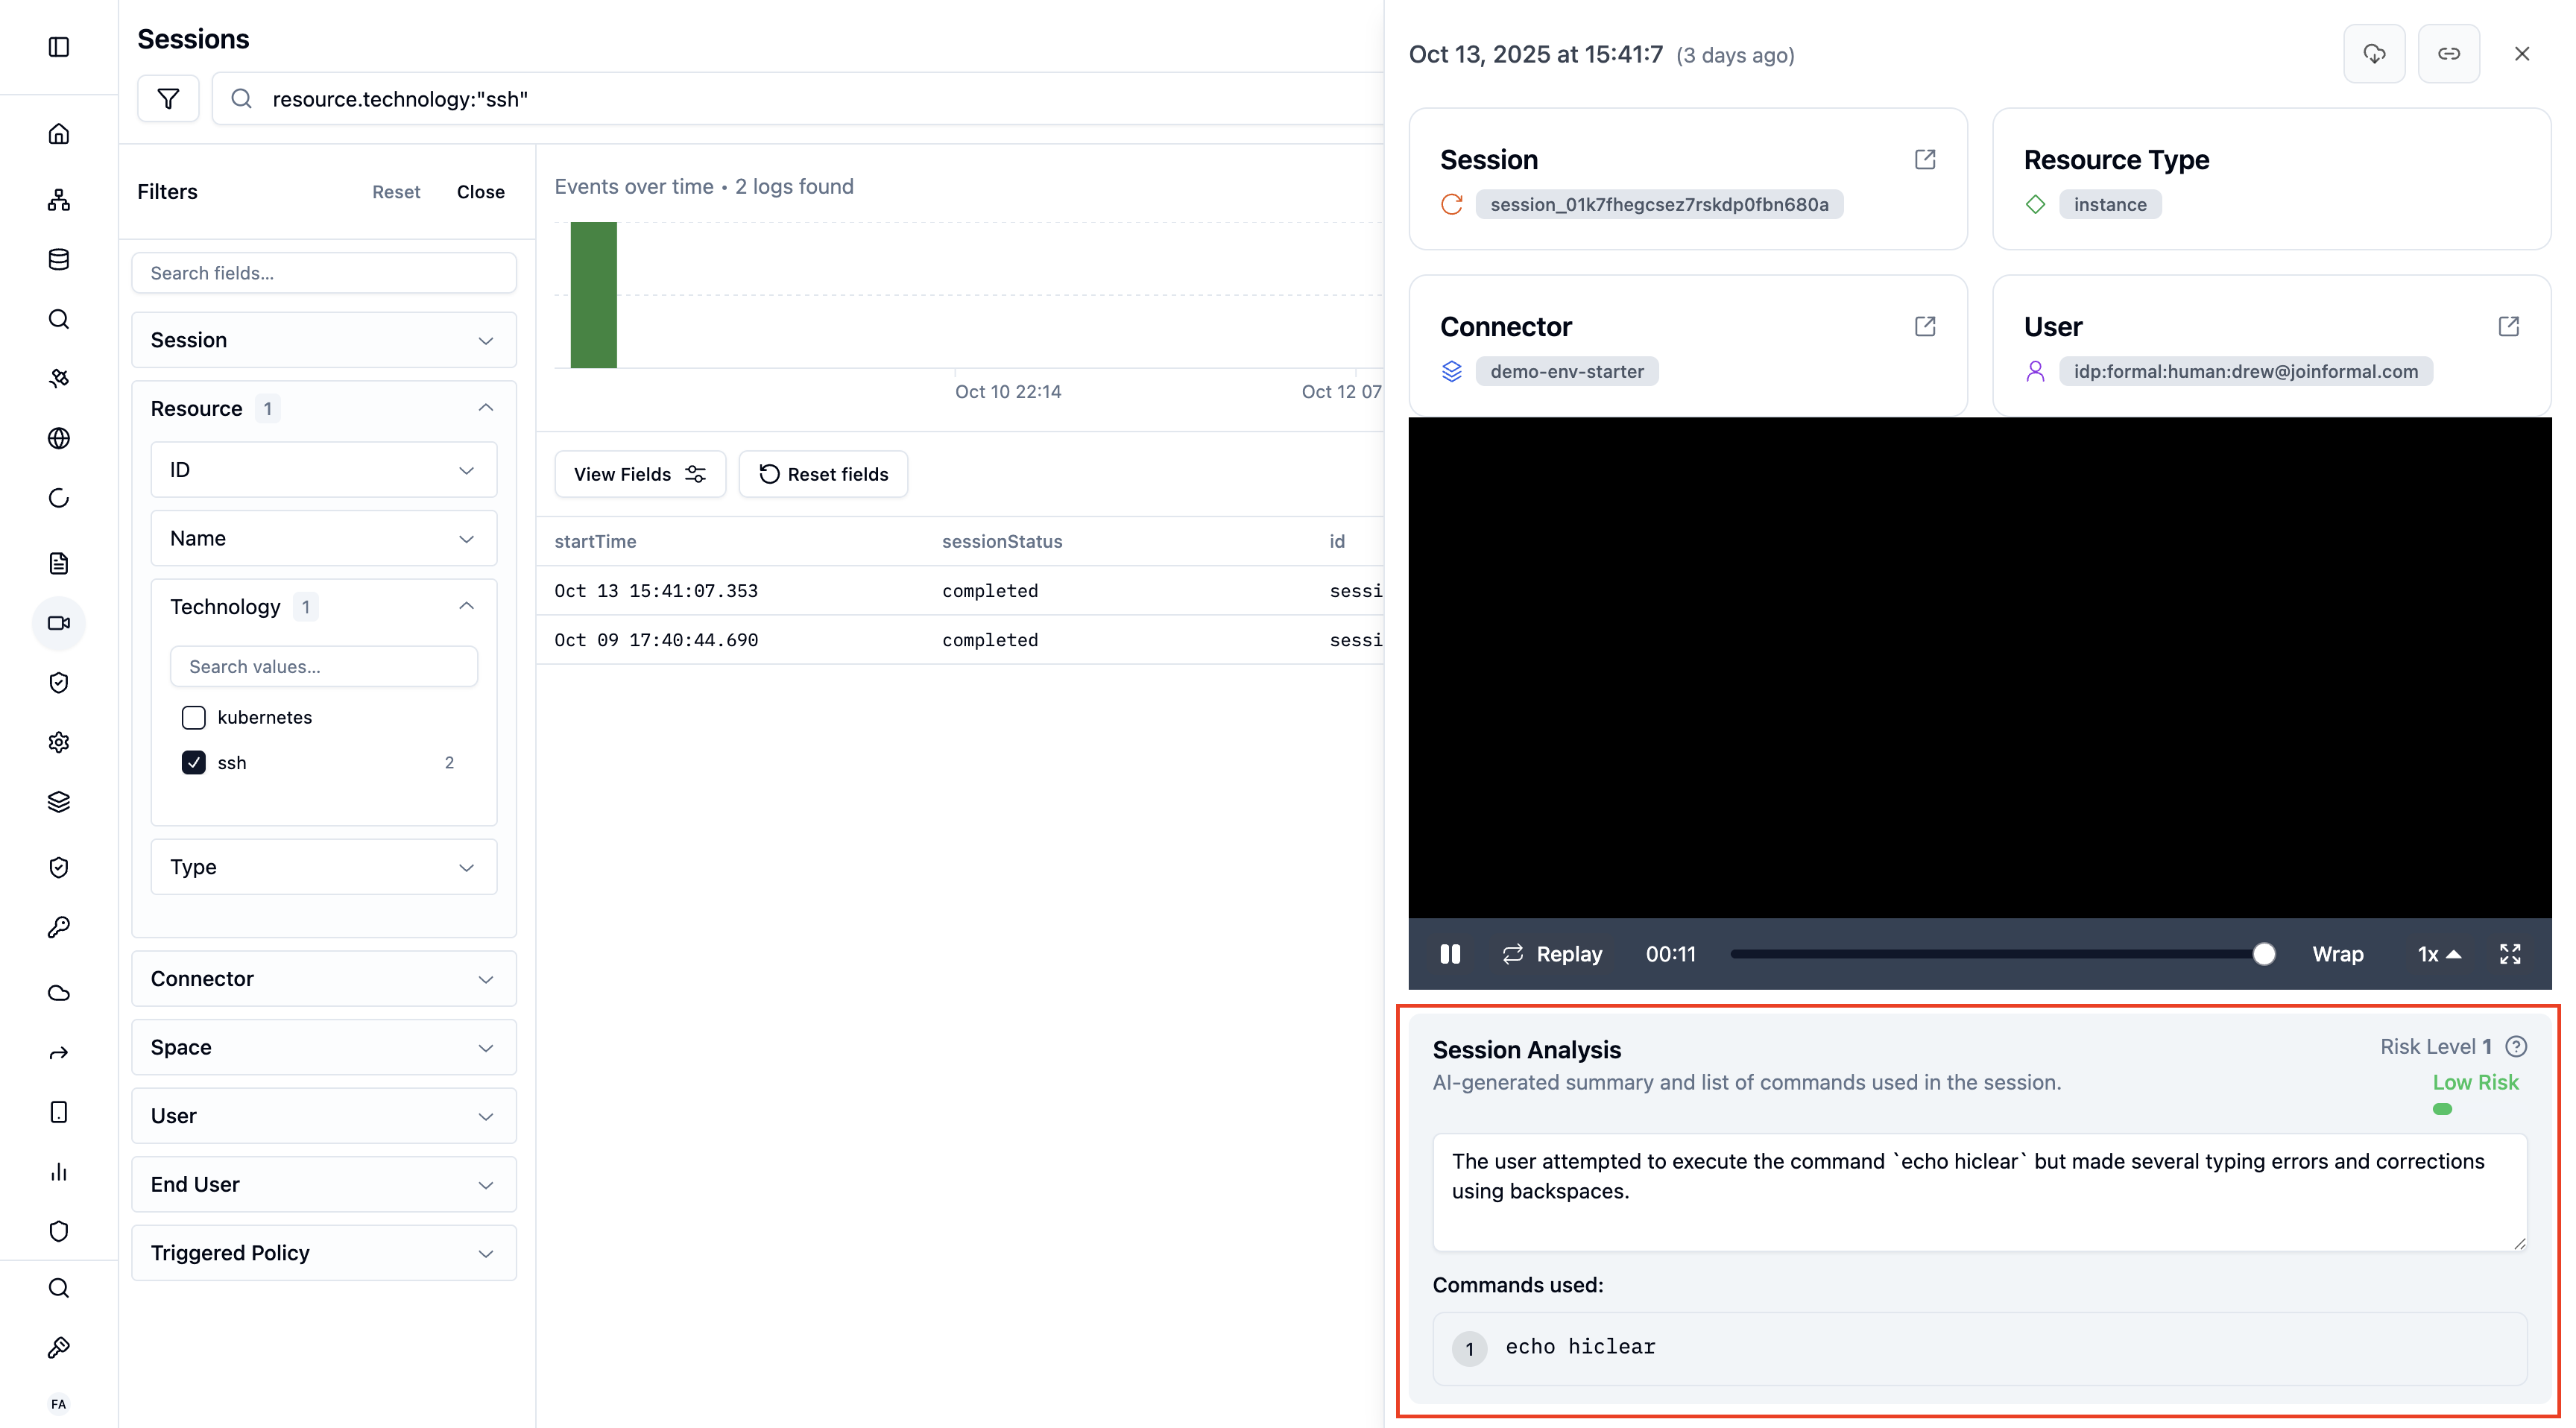
For SSH and Kubernetes sessions, Formal provides:
1. **Session Summary**: Natural language description of what happened
2. **Command List**: Extracted and categorized commands
3. **Risk Level**: Scored 1 (lowest) to 5 (highest) based on:
* Privilege escalation attempts
* File modifications or deletions
* Network reconnaissance
* Credential access
* Known attack patterns
### Risk Score Framework
Session analysis includes a Risk Score in real time. The score is based on the commands executed and the actions performed during the session:
**1 – Low Risk**
Basic informational commands (e.g., `ls`, `pwd`), viewing non-sensitive files with `cat`, standard navigation and user-space operations
**2 – Mild Risk**
File modifications in user space, basic software installations from trusted sources, non-sensitive configuration changes
**3 – Moderate Risk**
System configuration modifications, database operations, user management activities, service restarts or modifications
**4 – High Risk**
Privilege escalation attempts, access or modification of sensitive files, suspicious downloads or external connections, unusual system probing or reconnaissance
**5 – Critical Risk**
Execution of malicious payloads, data exfiltration attempts, backdoor creation or modification, credential theft attempts, suspicious encryption or decryption activities
Risk scoring helps prioritize which sessions to review during security audits
or incident response.
## Monitoring Sessions
### View Sessions
Navigate to [Sessions](https://app.formal.ai/sessions) in the Formal console to see:
* **All sessions**: Active and completed across all users and resources
* **Real-time updates**: Active sessions refresh automatically
* **Session details**: Click any session to view full details
### Filtering
Filter sessions by:
* **User**: Specific user or machine identity
* **Resource**: Which database, API, or server
* **Protocol**: PostgreSQL, SSH, HTTP, etc.
* **Time range**: Last hour, day, week, or custom
* **Status**: Active or completed
* **Risk level**: High-risk sessions only (SSH/K8s)
Use the left sidebar for quick filters or craft advanced queries for complex searches.
### Advanced Search
Sessions can be filtered by various parameters using the menu on the left side of the page or by crafting a more sophisticated Quickwit query. This flexibility allows for targeted monitoring and analysis of user sessions based on specific criteria.
Example queries:
```
# Find all sessions by user "alice"
user:alice
# High-risk SSH sessions in the last 24 hours
protocol:ssh AND risk_level:[4 TO 5] AND timestamp:[now-24h TO now]
# Failed authentication attempts
status:denied AND policy_action:deny_authentication
# Sessions accessing specific table
query:"FROM users" OR query:"JOIN users"
```
## Terminating Active Sessions
If a session is identified as active and there's a need to immediately halt the user's access or activities, Formal allows administrators to terminate the session directly from the UI. This immediate action can be crucial in preventing unauthorized data access or mitigating potential security breaches in real-time.
Navigate to the Sessions page and filter for Active
Click on the suspicious session to view details
Click **Terminate Session** in the session details
Confirm the session status changes to Completed
Terminating a session immediately disconnects the user. Any in-flight queries
or commands will be aborted.
## Session Metadata
Every session captures rich metadata:
| Field | Description |
| ---------------------- | --------------------------------------- |
| **Session ID** | Unique identifier |
| **User** | Formal user identity |
| **Resource** | Connected database, API, or server |
| **Protocol** | PostgreSQL, SSH, HTTP, etc. |
| **Start Time** | When connection began |
| **End Time** | When connection closed (completed only) |
| **Duration** | Total session length |
| **Queries/Commands** | Number of actions performed |
| **Policies Applied** | Which policies evaluated |
| **Actions Taken** | Denials, masking, rate limits |
| **Client IP** | Source IP address |
| **Client Application** | psql, Looker, ssh client, etc. |
## Use Cases
Review completed sessions to ensure no unauthorized access or suspicious
queries. Export session logs for compliance reporting.
When a security incident is detected, search sessions to find:
* What data was accessed
* Which users were involved
* Timeline of activities
* Attack patterns
Demonstrate to auditors:
* Who accessed what data and when
* That policies were enforced
* Complete audit trails for sensitive data
Understand access patterns:
* Which teams access which resources
* Query complexity and frequency
* Off-hours access patterns
* Anomalous behavior detection
Monitor active sessions for:
* Privilege escalation attempts
* Mass data exfiltration
* Unusual query patterns
* Unauthorized access attempts
## Best Practices
Configure alerts for high-risk sessions, failed authentications, or policy
violations. Integrate with Slack, PagerDuty, or your SIEM.
Schedule weekly or monthly reviews of high-risk sessions and policy denials to
identify potential threats early.
For SSH and Kubernetes sessions, review AI-generated summaries and risk scores
to prioritize investigations.
Regularly export session logs to your data warehouse or SIEM for long-term
retention and advanced analytics.
Keep an eye on active sessions during critical maintenance windows or
security incidents to catch issues in real-time.
## Next Steps
See all queries and API calls across sessions
Enforce rules based on session context
### AI-Powered Analysis
For SSH and Kubernetes sessions, Formal provides:
1. **Session Summary**: Natural language description of what happened
2. **Command List**: Extracted and categorized commands
3. **Risk Level**: Scored 1 (lowest) to 5 (highest) based on:
* Privilege escalation attempts
* File modifications or deletions
* Network reconnaissance
* Credential access
* Known attack patterns
### Risk Score Framework
Session analysis includes a Risk Score in real time. The score is based on the commands executed and the actions performed during the session:
**1 – Low Risk**
Basic informational commands (e.g., `ls`, `pwd`), viewing non-sensitive files with `cat`, standard navigation and user-space operations
**2 – Mild Risk**
File modifications in user space, basic software installations from trusted sources, non-sensitive configuration changes
**3 – Moderate Risk**
System configuration modifications, database operations, user management activities, service restarts or modifications
**4 – High Risk**
Privilege escalation attempts, access or modification of sensitive files, suspicious downloads or external connections, unusual system probing or reconnaissance
**5 – Critical Risk**
Execution of malicious payloads, data exfiltration attempts, backdoor creation or modification, credential theft attempts, suspicious encryption or decryption activities
Risk scoring helps prioritize which sessions to review during security audits
or incident response.
## Monitoring Sessions
### View Sessions
Navigate to [Sessions](https://app.formal.ai/sessions) in the Formal console to see:
* **All sessions**: Active and completed across all users and resources
* **Real-time updates**: Active sessions refresh automatically
* **Session details**: Click any session to view full details
### Filtering
Filter sessions by:
* **User**: Specific user or machine identity
* **Resource**: Which database, API, or server
* **Protocol**: PostgreSQL, SSH, HTTP, etc.
* **Time range**: Last hour, day, week, or custom
* **Status**: Active or completed
* **Risk level**: High-risk sessions only (SSH/K8s)
Use the left sidebar for quick filters or craft advanced queries for complex searches.
### Advanced Search
Sessions can be filtered by various parameters using the menu on the left side of the page or by crafting a more sophisticated Quickwit query. This flexibility allows for targeted monitoring and analysis of user sessions based on specific criteria.
Example queries:
```
# Find all sessions by user "alice"
user:alice
# High-risk SSH sessions in the last 24 hours
protocol:ssh AND risk_level:[4 TO 5] AND timestamp:[now-24h TO now]
# Failed authentication attempts
status:denied AND policy_action:deny_authentication
# Sessions accessing specific table
query:"FROM users" OR query:"JOIN users"
```
## Terminating Active Sessions
If a session is identified as active and there's a need to immediately halt the user's access or activities, Formal allows administrators to terminate the session directly from the UI. This immediate action can be crucial in preventing unauthorized data access or mitigating potential security breaches in real-time.
Navigate to the Sessions page and filter for Active
Click on the suspicious session to view details
Click **Terminate Session** in the session details
Confirm the session status changes to Completed
Terminating a session immediately disconnects the user. Any in-flight queries
or commands will be aborted.
## Session Metadata
Every session captures rich metadata:
| Field | Description |
| ---------------------- | --------------------------------------- |
| **Session ID** | Unique identifier |
| **User** | Formal user identity |
| **Resource** | Connected database, API, or server |
| **Protocol** | PostgreSQL, SSH, HTTP, etc. |
| **Start Time** | When connection began |
| **End Time** | When connection closed (completed only) |
| **Duration** | Total session length |
| **Queries/Commands** | Number of actions performed |
| **Policies Applied** | Which policies evaluated |
| **Actions Taken** | Denials, masking, rate limits |
| **Client IP** | Source IP address |
| **Client Application** | psql, Looker, ssh client, etc. |
## Use Cases
Review completed sessions to ensure no unauthorized access or suspicious
queries. Export session logs for compliance reporting.
When a security incident is detected, search sessions to find:
* What data was accessed
* Which users were involved
* Timeline of activities
* Attack patterns
Demonstrate to auditors:
* Who accessed what data and when
* That policies were enforced
* Complete audit trails for sensitive data
Understand access patterns:
* Which teams access which resources
* Query complexity and frequency
* Off-hours access patterns
* Anomalous behavior detection
Monitor active sessions for:
* Privilege escalation attempts
* Mass data exfiltration
* Unusual query patterns
* Unauthorized access attempts
## Best Practices
Configure alerts for high-risk sessions, failed authentications, or policy
violations. Integrate with Slack, PagerDuty, or your SIEM.
Schedule weekly or monthly reviews of high-risk sessions and policy denials to
identify potential threats early.
For SSH and Kubernetes sessions, review AI-generated summaries and risk scores
to prioritize investigations.
Regularly export session logs to your data warehouse or SIEM for long-term
retention and advanced analytics.
Keep an eye on active sessions during critical maintenance windows or
security incidents to catch issues in real-time.
## Next Steps
See all queries and API calls across sessions
Enforce rules based on session context