> ## Documentation Index
> Fetch the complete documentation index at: https://docs.formal.ai/llms.txt
> Use this file to discover all available pages before exploring further.
# Logs
> Monitor, search, and analyze all queries and commands executed through Formal Connectors
## Overview
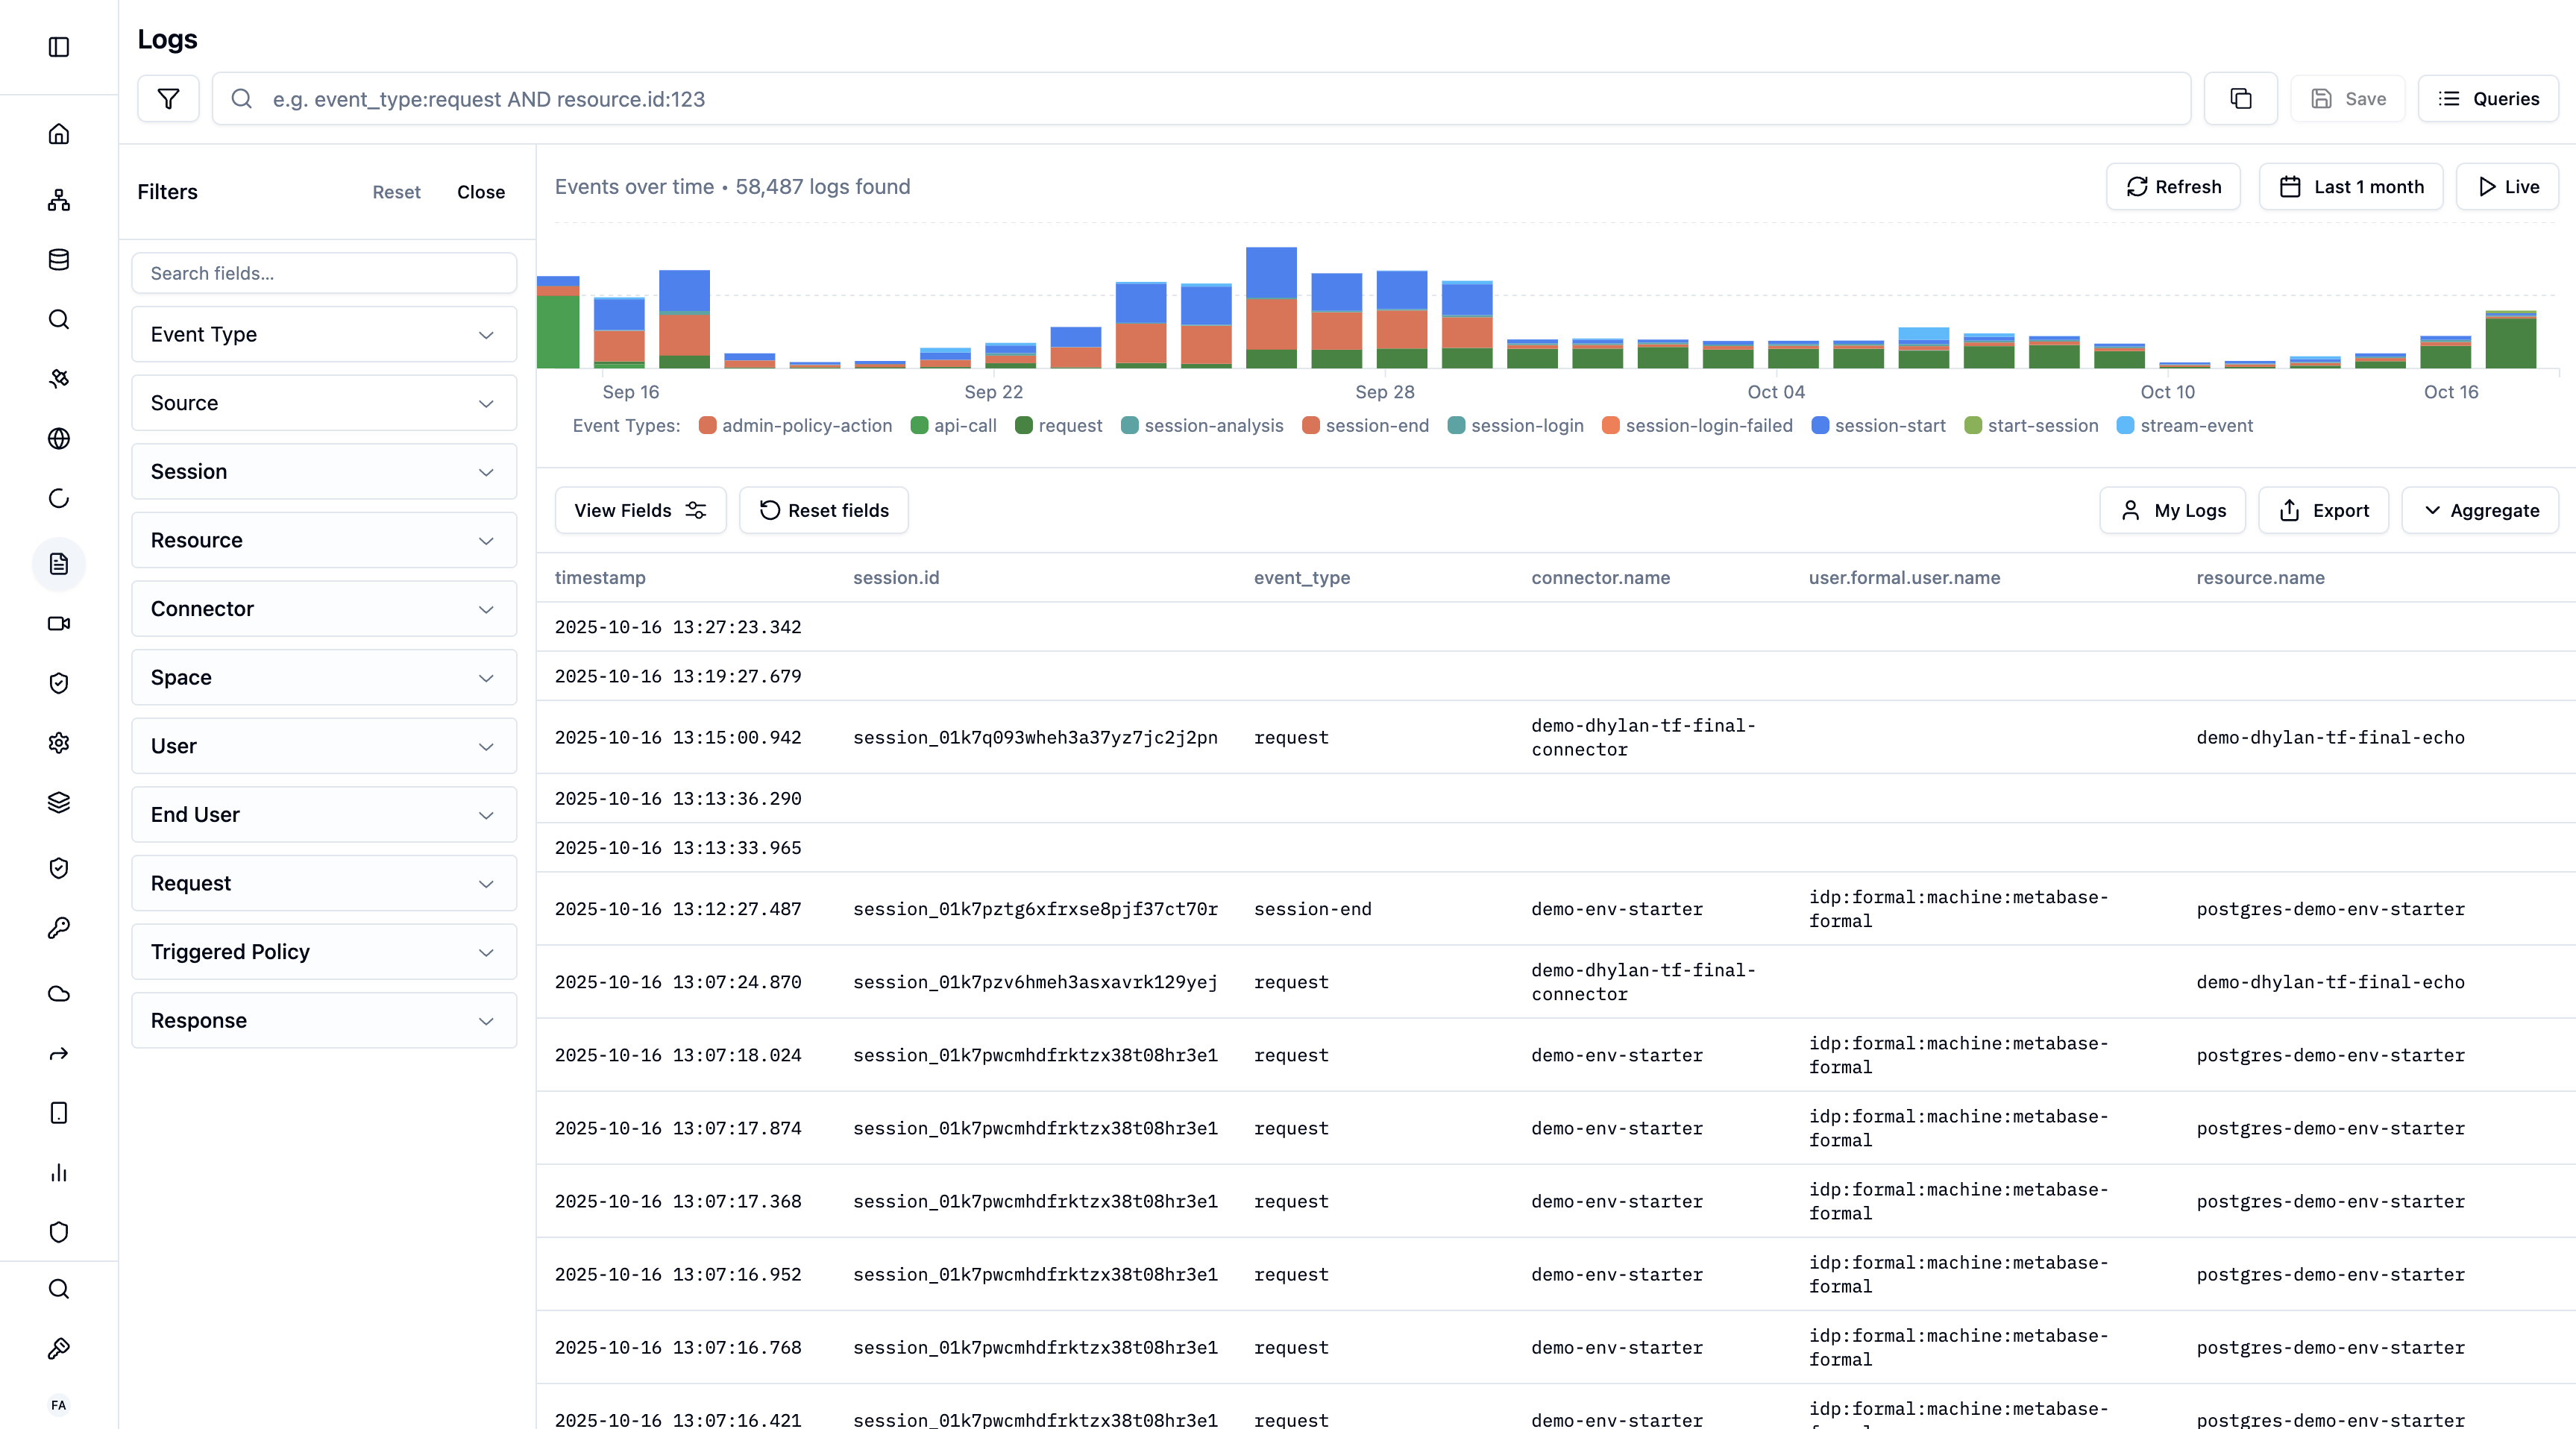
Every query, command, and API call that flows through Formal Connectors is logged and stored for auditing, compliance, and security analysis. Formal's log system provides comprehensive visibility into data access across your organization.
 ## What Gets Logged
Full SQL/NoSQL queries, execution time, rows affected
HTTP requests, headers, request/response bodies, status codes
Every command executed in SSH sessions
kubectl exec sessions and commands
Create, Read, Update, and Delete API calls made to the Control Plane
## Log Enrichment
Formal automatically enriches each Connector log entry with contextual information:
| Field | Description |
| ------------------ | -------------------------------------------------- |
| **Timestamp** | When the query/command was executed |
| **User** | Formal user who made the request |
| **End-User** | Actual end-user (for BI tool queries) |
| **Resource** | Target database, API, or server |
| **Connector** | Which Connector processed the request |
| **Session ID** | Associated session identifier |
| **Policy Actions** | Any policy enforcement (mask, block, filter, etc.) |
| **Client IP** | Source IP address |
| **Application** | Client application (psql, Looker, etc.) |
| **Duration** | Query execution time |
| **Rows Affected** | Number of records touched |
Control Plane API calls are enriched with the following information:
| Field | Description |
| ------------------ | ---------------------------------------------------------------------------------------------------------------------------- |
| **Timestamp** | When the API call was made |
| **User** | Formal user who made the request |
| **Command** | The API call that was made (e.g. `UpdatePolicy`) and type (`create`, `read`, `update`, `delete`) |
| **Arguments** | The arguments passed to the API call as part of the request payload (sensitive arguments like passwords are always redacted) |
| **Service** | The service that the API call was made to (e.g. `logs`) |
| **Request Method** | The HTTP method used for the API call (e.g. `GET`, `POST`) |
| **IP Address** | Source IP address |
## Accessing Logs
Navigate to [Logs](https://app.formal.ai/logs) in the Formal console to view all logged activity.
### Viewing Modes
**Default view** that displays all log entries chronologically.
* See individual queries/commands
* Click any row to open detailed panel
* Filter and search across all fields
* Export to CSV
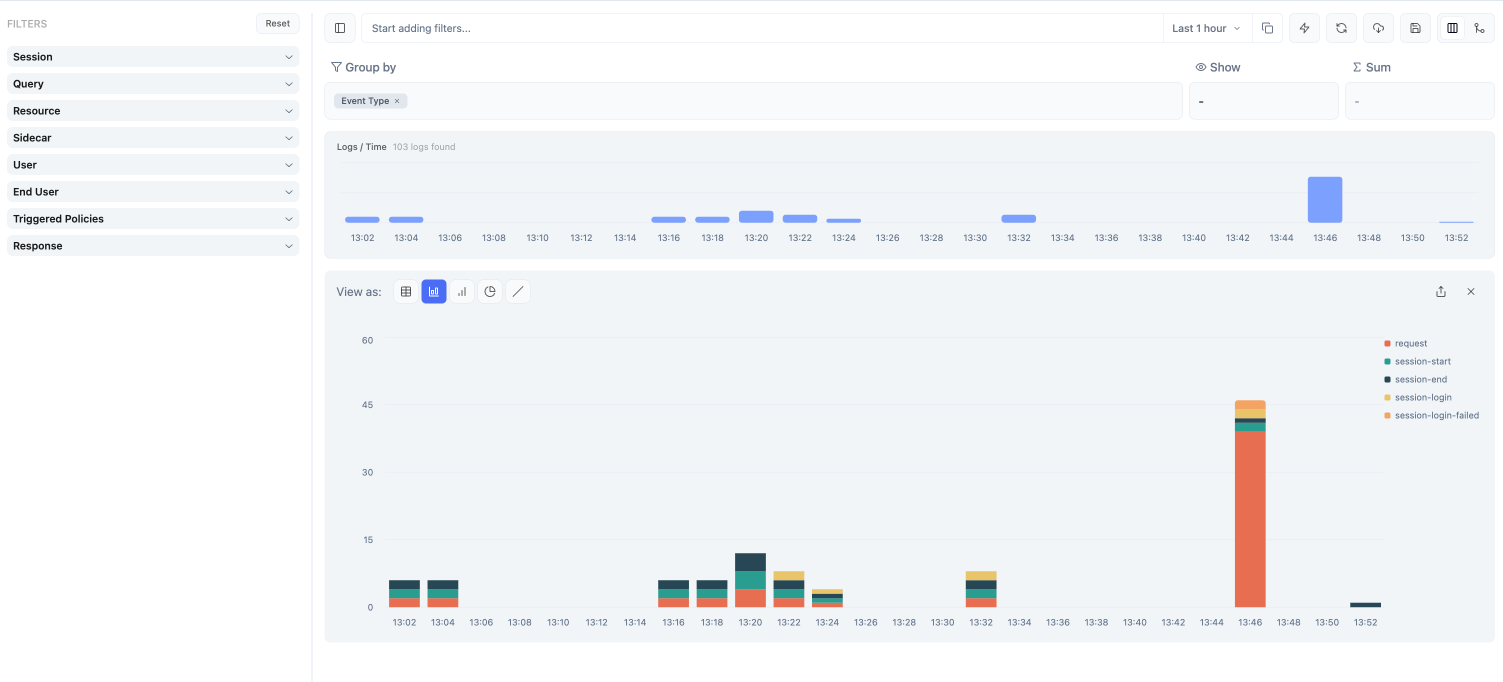
**Advanced analytics** with grouping and visualization.
* Group by connector, resource, user, etc.
* Visualize with charts:
* Timeseries
* Bar chart
* Pie chart
* Line chart
* Table
* Identify trends and patterns
* Spot anomalies
## What Gets Logged
Full SQL/NoSQL queries, execution time, rows affected
HTTP requests, headers, request/response bodies, status codes
Every command executed in SSH sessions
kubectl exec sessions and commands
Create, Read, Update, and Delete API calls made to the Control Plane
## Log Enrichment
Formal automatically enriches each Connector log entry with contextual information:
| Field | Description |
| ------------------ | -------------------------------------------------- |
| **Timestamp** | When the query/command was executed |
| **User** | Formal user who made the request |
| **End-User** | Actual end-user (for BI tool queries) |
| **Resource** | Target database, API, or server |
| **Connector** | Which Connector processed the request |
| **Session ID** | Associated session identifier |
| **Policy Actions** | Any policy enforcement (mask, block, filter, etc.) |
| **Client IP** | Source IP address |
| **Application** | Client application (psql, Looker, etc.) |
| **Duration** | Query execution time |
| **Rows Affected** | Number of records touched |
Control Plane API calls are enriched with the following information:
| Field | Description |
| ------------------ | ---------------------------------------------------------------------------------------------------------------------------- |
| **Timestamp** | When the API call was made |
| **User** | Formal user who made the request |
| **Command** | The API call that was made (e.g. `UpdatePolicy`) and type (`create`, `read`, `update`, `delete`) |
| **Arguments** | The arguments passed to the API call as part of the request payload (sensitive arguments like passwords are always redacted) |
| **Service** | The service that the API call was made to (e.g. `logs`) |
| **Request Method** | The HTTP method used for the API call (e.g. `GET`, `POST`) |
| **IP Address** | Source IP address |
## Accessing Logs
Navigate to [Logs](https://app.formal.ai/logs) in the Formal console to view all logged activity.
### Viewing Modes
**Default view** that displays all log entries chronologically.
* See individual queries/commands
* Click any row to open detailed panel
* Filter and search across all fields
* Export to CSV
**Advanced analytics** with grouping and visualization.
* Group by connector, resource, user, etc.
* Visualize with charts:
* Timeseries
* Bar chart
* Pie chart
* Line chart
* Table
* Identify trends and patterns
* Spot anomalies
 ### Aggregation Examples
Use Aggregation Mode to answer common operational and security questions:
| Question | Group By | Visualization | Filter |
| ------------------------------------ | ------------------------- | ------------- | --------------------------------- |
| Which users run the most queries? | `user.formal.user.email` | Bar chart | `event_type:request` |
| What resources get the most traffic? | `resource.name` | Pie chart | `event_type:request` |
| How many policy blocks per day? | `timestamp` (1d interval) | Timeseries | `triggered_policies.type:block` |
| Top blocked queries by user | `user.formal.user.email` | Table | `triggered_policies.type:block` |
| Query volume by technology | `resource.technology` | Pie chart | `event_type:request` |
| Failed login attempts over time | `timestamp` (1h interval) | Timeseries | `event_type:session-login-failed` |
| Data access by group | `user.formal.user.groups` | Bar chart | `event_type:request` |
| Masking activity per resource | `resource.name` | Bar chart | `triggered_policies.type:mask` |
Combine aggregation with time range filters to compare patterns across periods
— for example, compare this week's query volume to last week's to spot
anomalies.
## Log Details Panel
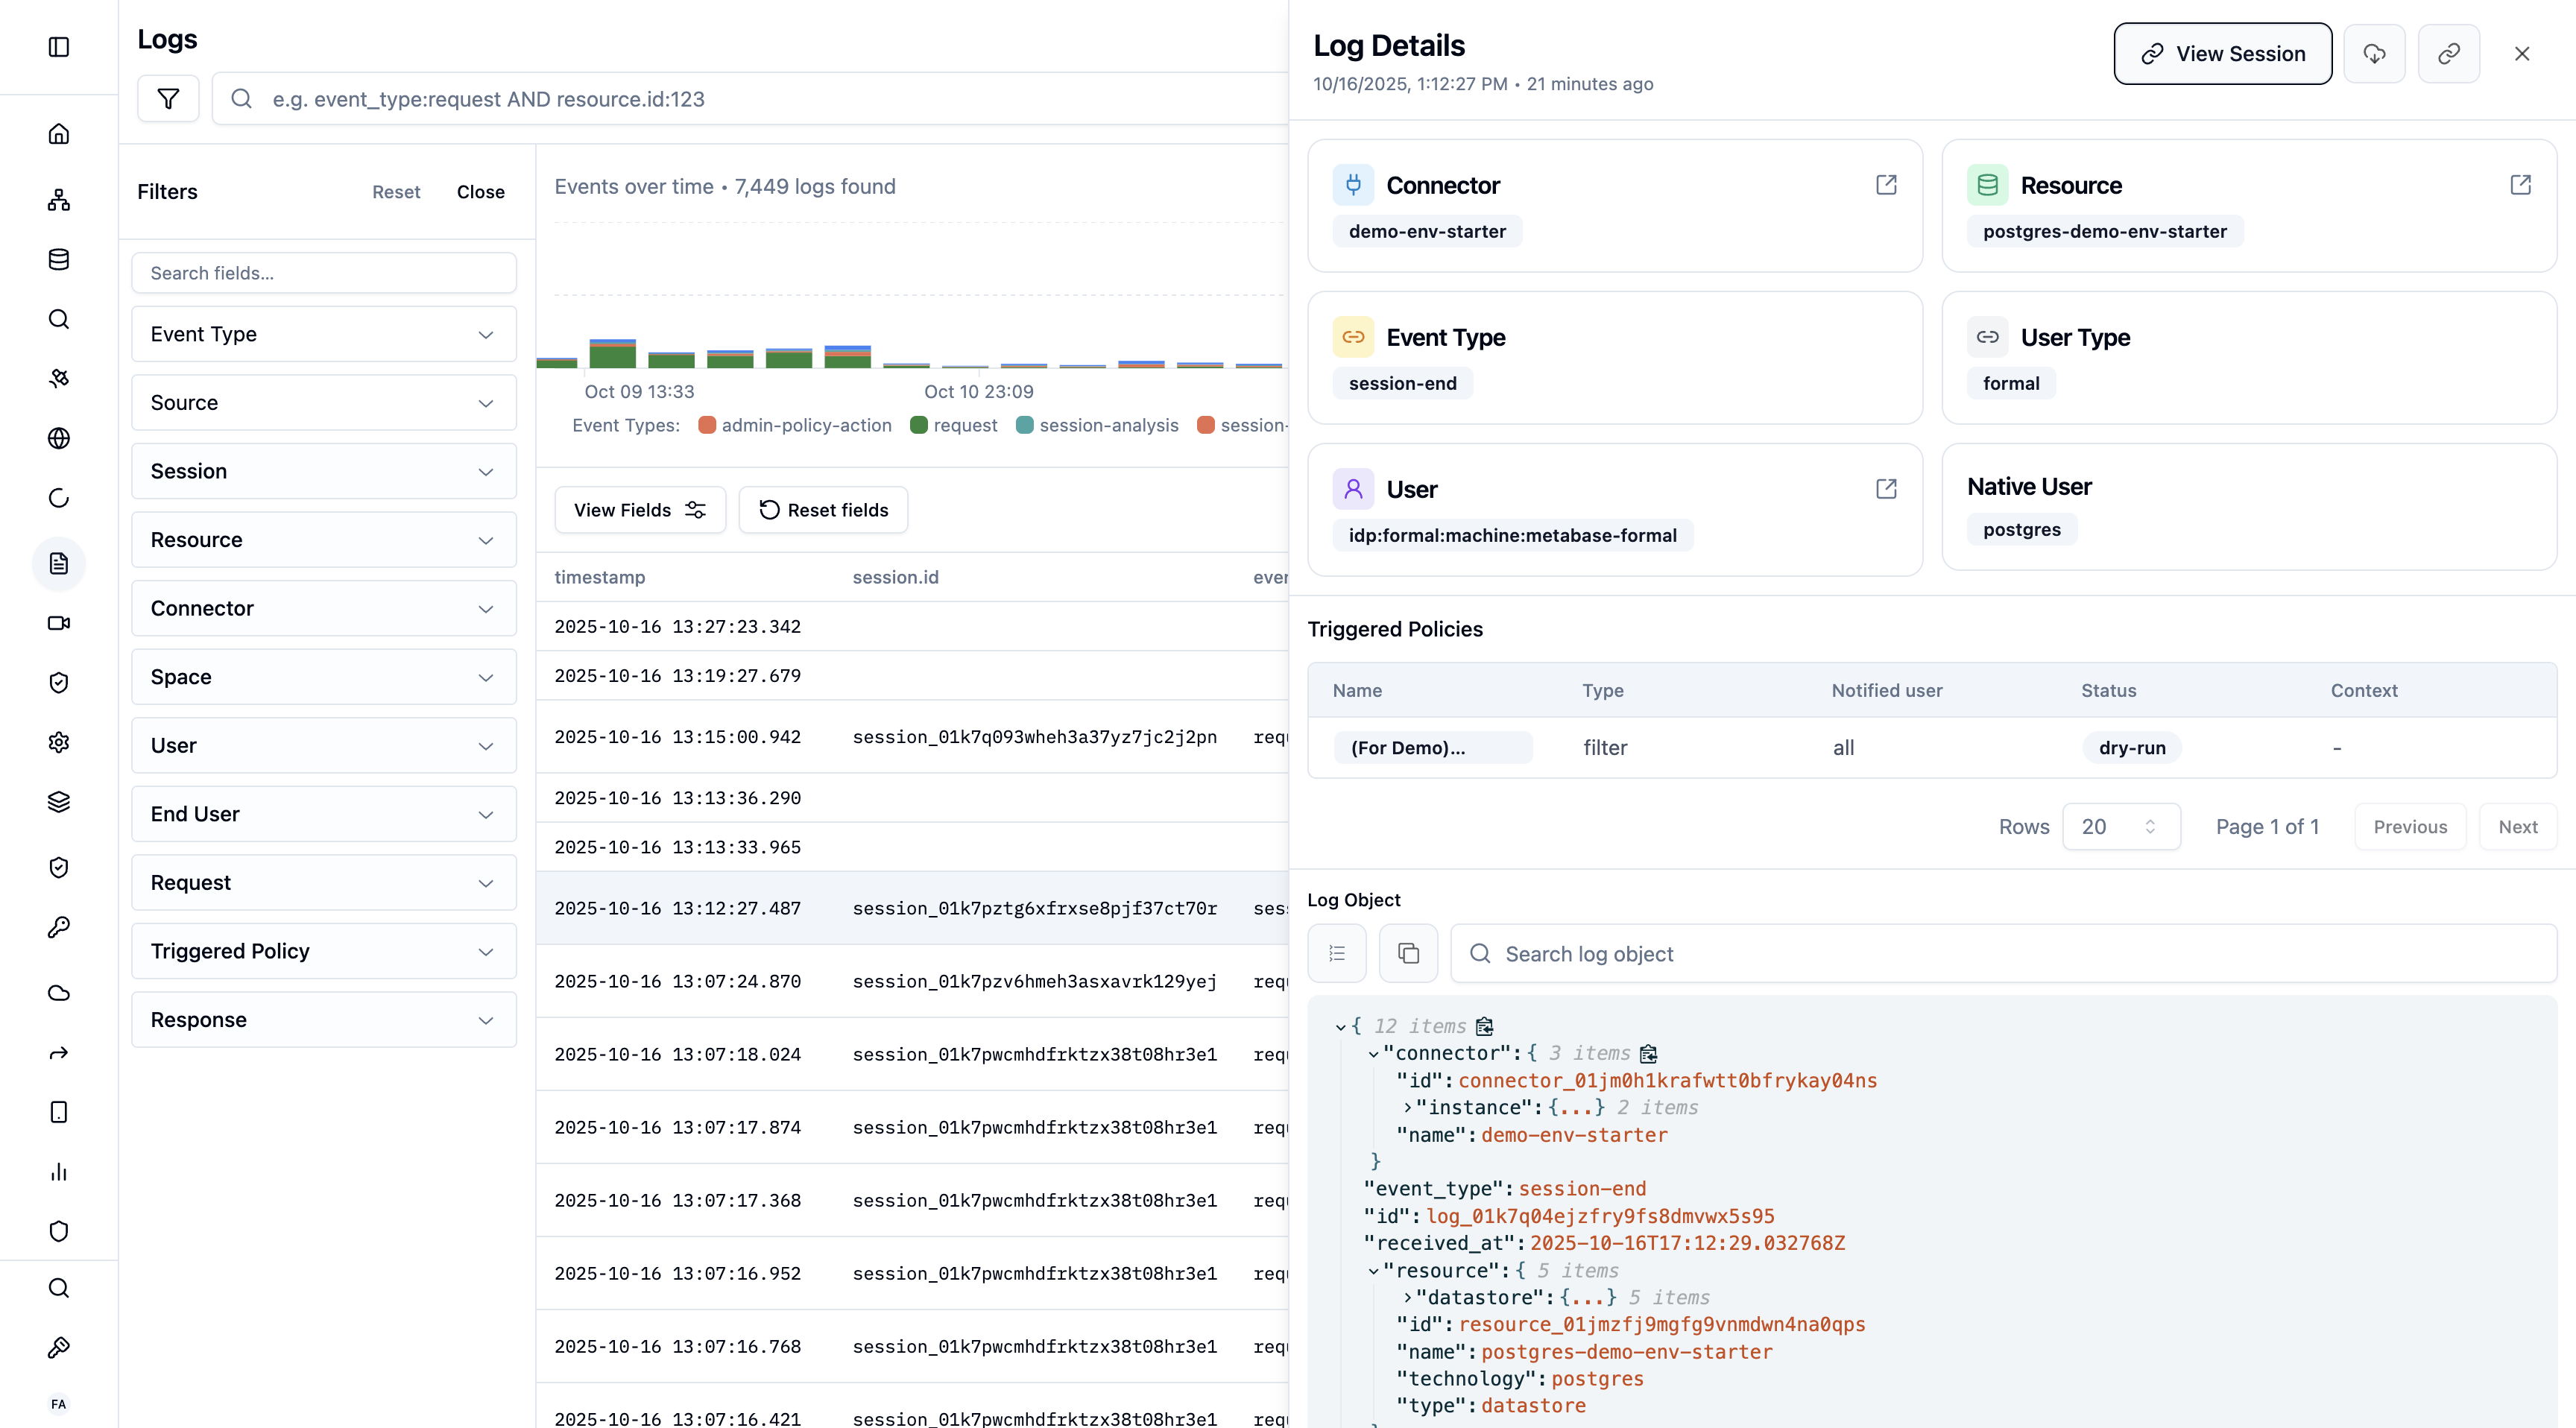
Click any log entry to view comprehensive details:
### Aggregation Examples
Use Aggregation Mode to answer common operational and security questions:
| Question | Group By | Visualization | Filter |
| ------------------------------------ | ------------------------- | ------------- | --------------------------------- |
| Which users run the most queries? | `user.formal.user.email` | Bar chart | `event_type:request` |
| What resources get the most traffic? | `resource.name` | Pie chart | `event_type:request` |
| How many policy blocks per day? | `timestamp` (1d interval) | Timeseries | `triggered_policies.type:block` |
| Top blocked queries by user | `user.formal.user.email` | Table | `triggered_policies.type:block` |
| Query volume by technology | `resource.technology` | Pie chart | `event_type:request` |
| Failed login attempts over time | `timestamp` (1h interval) | Timeseries | `event_type:session-login-failed` |
| Data access by group | `user.formal.user.groups` | Bar chart | `event_type:request` |
| Masking activity per resource | `resource.name` | Bar chart | `triggered_policies.type:mask` |
Combine aggregation with time range filters to compare patterns across periods
— for example, compare this week's query volume to last week's to spot
anomalies.
## Log Details Panel
Click any log entry to view comprehensive details:
 ### What's Included
* **Full Query/Command**: Complete text of what was executed
* **User Context**: User, end-user, groups, email
* **Resource Information**: Database, hostname, port, technology
* **Policy Evaluation**: Which policies evaluated, actions taken, reasons
* **Performance Metrics**: Duration, rows affected, data transferred
* **Network Information**: Client IP, application, connection details
* **Session Link**: Jump to associated session recording
## Log Schema Reference
Every log entry follows a structured schema with nested fields. You can query any of these fields using [Quickwit syntax](#advanced-search).
### Event and Session Fields
| Field | Type | Description |
| ----------------------------------- | -------- | ---------------------------------------------------------------------------------------------------------------------------------------------------------------------------------------------- |
| `event_type` | String | Event type: `request`, `session-start`, `session-end`, `session-login`, `session-login-failed`, `session-analysis`, `stream-event`, `admin-policy-action`, `control-plane-request`, `workflow` |
| `timestamp` | DateTime | When the event occurred (RFC3339) |
| `session.id` | String | Session identifier |
| `session.application.name` | String | Client application (e.g., `psql`, `mongosh`) |
| `session.network.client_ip_address` | String | Client IP and port |
| `session.network.server_ip_address` | String | Server IP and port |
### User Fields
| Field | Type | Description |
| ----------------------------- | --------- | ------------------------------------ |
| `user.type` | String | `formal` or `native` |
| `user.username` | String | Native username |
| `user.formal.user.email` | String | Formal user email |
| `user.formal.user.id` | String | Formal user ID |
| `user.formal.user.type` | String | `human` or `machine` |
| `user.formal.user.groups` | \[]String | User group memberships |
| `user.formal.end_user.email` | String | End-user email (for BI tool queries) |
| `user.formal.end_user.name` | String | End-user name |
| `user.formal.end_user.groups` | \[]String | End-user groups |
### Resource Fields
| Field | Type | Description |
| ----------------------------- | ------ | ------------------------------------------------------------------------------------ |
| `resource.id` | String | Resource identifier |
| `resource.name` | String | Resource name |
| `resource.type` | String | Resource type |
| `resource.technology` | String | `postgres`, `mysql`, `mongodb`, `snowflake`, `http`, `ssh`, `kubernetes`, `s3`, etc. |
| `resource.datastore.hostname` | String | Resource hostname |
### Request and Response Fields
| Field | Type | Description |
| ------------------------------------------------ | ------- | ----------------------------------------------- |
| `request.query.received` | String | Query as received from the client |
| `request.query.sent` | String | Query as sent to the resource (after rewriting) |
| `request.query.normalized` | String | Normalized query (parameters removed) |
| `request.query.fingerprint` | String | Query fingerprint for grouping similar queries |
| `response.datastore.rows_count.received` | Integer | Rows returned by the resource |
| `response.datastore.rows_count.sent` | Integer | Rows sent to the client (after filtering) |
| `response.datastore.returned_columns.name` | String | Column name |
| `response.datastore.returned_columns.path` | String | Full column path |
| `response.datastore.returned_columns.data_label` | String | Data classification label |
### Policy Fields
| Field | Type | Description |
| --------------------------- | ------ | ------------------------------------------------------- |
| `triggered_policies.id` | String | Policy ID |
| `triggered_policies.name` | String | Policy name |
| `triggered_policies.status` | String | Policy status (`active`, `dry_run`) |
| `triggered_policies.type` | String | Action taken (`block`, `mask`, `filter`, `allow`, etc.) |
### Connector and Space Fields
| Field | Type | Description |
| ---------------- | ------ | -------------------- |
| `connector.id` | String | Connector identifier |
| `connector.name` | String | Connector name |
| `space.id` | String | Space identifier |
| `space.name` | String | Space name |
### Control Plane Fields
| Field | Type | Description |
| ------------------------------------ | ------ | --------------------------------------- |
| `control_plane_request.command.name` | String | API command (e.g., `UpdatePolicy`) |
| `control_plane_request.command.type` | String | `create`, `read`, `update`, `delete` |
| `control_plane_request.service` | String | Service name (e.g., `policies`, `logs`) |
| `control_plane_request.method` | String | HTTP method |
| `control_plane_request.user.email` | String | User who made the API call |
### Device Fields
| Field | Type | Description |
| ---------------------------------------- | ------ | ------------------- |
| `session.device.hardware.model_name` | String | Device model |
| `session.device.hardware.model_number` | String | Device model number |
| `session.device.software.system_version` | String | OS version |
| `session.device.software.kernel_version` | String | Kernel version |
## Filtering and Search
Formal uses [Quickwit](https://quickwit.io/) query engine for powerful search capabilities.
### Basic Filters
Use the sidebar to filter by:
* Connector
* Resource
* User
* End-user
* Group
* Technology (postgres, ssh, http, etc.)
* Time range
### Advanced Search
Write Quickwit queries for complex searches:
```
# Find all queries by user Alice
user:alice@example.com
# Find queries that triggered policies
policy_actions:* AND NOT policy_actions:allow
# Find slow queries (>1 second)
duration_ms:[1000 TO *]
# Find DELETE statements in production
query:"DELETE" AND resource:production-postgres
# Find SSH commands containing "sudo"
command:"sudo" AND technology:ssh
# Find queries accessing specific table
query:"FROM users" OR query:"JOIN users"
# Complex: Find non-admin users accessing PII tables
user.groups:(NOT admin) AND (table:"users_pii" OR table:"customers_sensitive")
# Time-based: Queries in the last 24 hours
timestamp:[now-24h TO now]
# Failed authentications
status:denied AND policy_action:block_authentication
```
## Query Templates
Formal provides pre-built query templates:
| Template | Description | Query |
| ---------------------- | -------------------------------- | -------------------------------------------------------- |
| **Formal Users** | System-generated users | `user.type:formal` |
| **Native Users** | Queries using native credentials | `user_type:native` |
| **Triggered Policies** | Logs with policy enforcement | `policy_actions:* AND NOT policy_actions:allow` |
| **Datastore Queries** | Database queries | `technology:(postgres OR mysql OR mongodb OR snowflake)` |
| **HTTP Requests** | API calls | `technology:http` |
| **S3 Requests** | S3 operations | `technology:s3` |
| **Encrypted Requests** | Queries with encryption | `request.query.encrypted:true` |
| **SSH Sessions** | Terminal sessions | `technology:ssh` |
## Query Library
### What's Included
* **Full Query/Command**: Complete text of what was executed
* **User Context**: User, end-user, groups, email
* **Resource Information**: Database, hostname, port, technology
* **Policy Evaluation**: Which policies evaluated, actions taken, reasons
* **Performance Metrics**: Duration, rows affected, data transferred
* **Network Information**: Client IP, application, connection details
* **Session Link**: Jump to associated session recording
## Log Schema Reference
Every log entry follows a structured schema with nested fields. You can query any of these fields using [Quickwit syntax](#advanced-search).
### Event and Session Fields
| Field | Type | Description |
| ----------------------------------- | -------- | ---------------------------------------------------------------------------------------------------------------------------------------------------------------------------------------------- |
| `event_type` | String | Event type: `request`, `session-start`, `session-end`, `session-login`, `session-login-failed`, `session-analysis`, `stream-event`, `admin-policy-action`, `control-plane-request`, `workflow` |
| `timestamp` | DateTime | When the event occurred (RFC3339) |
| `session.id` | String | Session identifier |
| `session.application.name` | String | Client application (e.g., `psql`, `mongosh`) |
| `session.network.client_ip_address` | String | Client IP and port |
| `session.network.server_ip_address` | String | Server IP and port |
### User Fields
| Field | Type | Description |
| ----------------------------- | --------- | ------------------------------------ |
| `user.type` | String | `formal` or `native` |
| `user.username` | String | Native username |
| `user.formal.user.email` | String | Formal user email |
| `user.formal.user.id` | String | Formal user ID |
| `user.formal.user.type` | String | `human` or `machine` |
| `user.formal.user.groups` | \[]String | User group memberships |
| `user.formal.end_user.email` | String | End-user email (for BI tool queries) |
| `user.formal.end_user.name` | String | End-user name |
| `user.formal.end_user.groups` | \[]String | End-user groups |
### Resource Fields
| Field | Type | Description |
| ----------------------------- | ------ | ------------------------------------------------------------------------------------ |
| `resource.id` | String | Resource identifier |
| `resource.name` | String | Resource name |
| `resource.type` | String | Resource type |
| `resource.technology` | String | `postgres`, `mysql`, `mongodb`, `snowflake`, `http`, `ssh`, `kubernetes`, `s3`, etc. |
| `resource.datastore.hostname` | String | Resource hostname |
### Request and Response Fields
| Field | Type | Description |
| ------------------------------------------------ | ------- | ----------------------------------------------- |
| `request.query.received` | String | Query as received from the client |
| `request.query.sent` | String | Query as sent to the resource (after rewriting) |
| `request.query.normalized` | String | Normalized query (parameters removed) |
| `request.query.fingerprint` | String | Query fingerprint for grouping similar queries |
| `response.datastore.rows_count.received` | Integer | Rows returned by the resource |
| `response.datastore.rows_count.sent` | Integer | Rows sent to the client (after filtering) |
| `response.datastore.returned_columns.name` | String | Column name |
| `response.datastore.returned_columns.path` | String | Full column path |
| `response.datastore.returned_columns.data_label` | String | Data classification label |
### Policy Fields
| Field | Type | Description |
| --------------------------- | ------ | ------------------------------------------------------- |
| `triggered_policies.id` | String | Policy ID |
| `triggered_policies.name` | String | Policy name |
| `triggered_policies.status` | String | Policy status (`active`, `dry_run`) |
| `triggered_policies.type` | String | Action taken (`block`, `mask`, `filter`, `allow`, etc.) |
### Connector and Space Fields
| Field | Type | Description |
| ---------------- | ------ | -------------------- |
| `connector.id` | String | Connector identifier |
| `connector.name` | String | Connector name |
| `space.id` | String | Space identifier |
| `space.name` | String | Space name |
### Control Plane Fields
| Field | Type | Description |
| ------------------------------------ | ------ | --------------------------------------- |
| `control_plane_request.command.name` | String | API command (e.g., `UpdatePolicy`) |
| `control_plane_request.command.type` | String | `create`, `read`, `update`, `delete` |
| `control_plane_request.service` | String | Service name (e.g., `policies`, `logs`) |
| `control_plane_request.method` | String | HTTP method |
| `control_plane_request.user.email` | String | User who made the API call |
### Device Fields
| Field | Type | Description |
| ---------------------------------------- | ------ | ------------------- |
| `session.device.hardware.model_name` | String | Device model |
| `session.device.hardware.model_number` | String | Device model number |
| `session.device.software.system_version` | String | OS version |
| `session.device.software.kernel_version` | String | Kernel version |
## Filtering and Search
Formal uses [Quickwit](https://quickwit.io/) query engine for powerful search capabilities.
### Basic Filters
Use the sidebar to filter by:
* Connector
* Resource
* User
* End-user
* Group
* Technology (postgres, ssh, http, etc.)
* Time range
### Advanced Search
Write Quickwit queries for complex searches:
```
# Find all queries by user Alice
user:alice@example.com
# Find queries that triggered policies
policy_actions:* AND NOT policy_actions:allow
# Find slow queries (>1 second)
duration_ms:[1000 TO *]
# Find DELETE statements in production
query:"DELETE" AND resource:production-postgres
# Find SSH commands containing "sudo"
command:"sudo" AND technology:ssh
# Find queries accessing specific table
query:"FROM users" OR query:"JOIN users"
# Complex: Find non-admin users accessing PII tables
user.groups:(NOT admin) AND (table:"users_pii" OR table:"customers_sensitive")
# Time-based: Queries in the last 24 hours
timestamp:[now-24h TO now]
# Failed authentications
status:denied AND policy_action:block_authentication
```
## Query Templates
Formal provides pre-built query templates:
| Template | Description | Query |
| ---------------------- | -------------------------------- | -------------------------------------------------------- |
| **Formal Users** | System-generated users | `user.type:formal` |
| **Native Users** | Queries using native credentials | `user_type:native` |
| **Triggered Policies** | Logs with policy enforcement | `policy_actions:* AND NOT policy_actions:allow` |
| **Datastore Queries** | Database queries | `technology:(postgres OR mysql OR mongodb OR snowflake)` |
| **HTTP Requests** | API calls | `technology:http` |
| **S3 Requests** | S3 operations | `technology:s3` |
| **Encrypted Requests** | Queries with encryption | `request.query.encrypted:true` |
| **SSH Sessions** | Terminal sessions | `technology:ssh` |
## Query Library
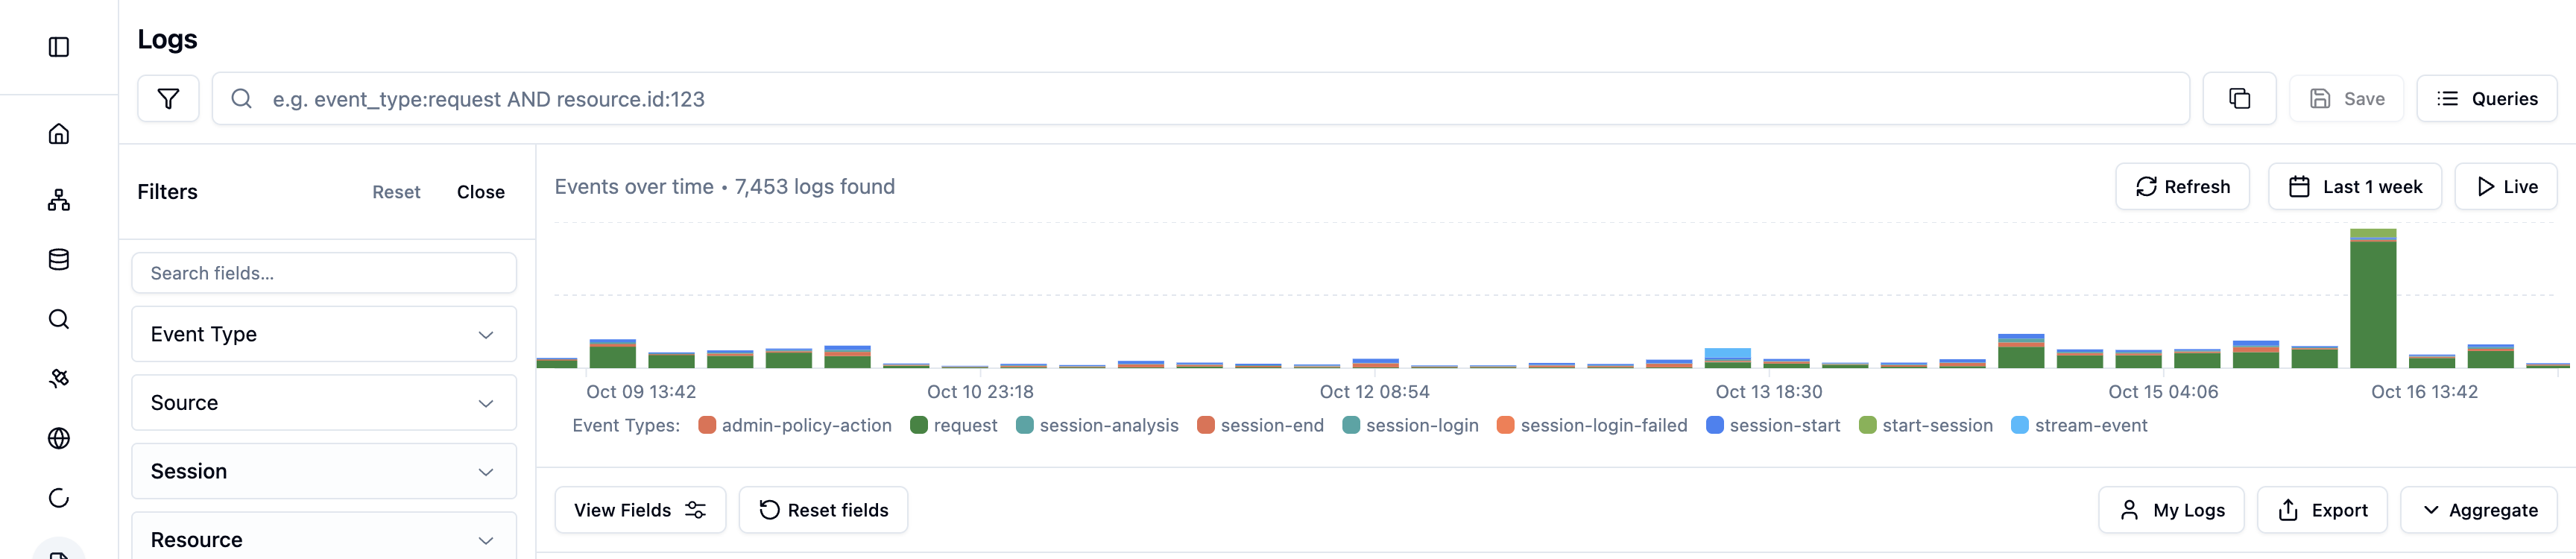 Access your queries by clicking **Queries** in the toolbar. The Query Library provides three tabs:
### Recent Queries
View your search history:
1. Click **Queries** to open the Query Library
2. View the **Recent** tab (default)
3. Select any previous query to re-run it
4. History persists across sessions
### Saved Queries
Save frequently used queries for quick access:
1. Create your query with filters or search terms
2. Click **Save** in the toolbar
3. Name your query
4. Access later from **Queries** → **Saved** tab
### Template Queries
Pre-built queries for common use cases. Click **Queries** → **Templates** to browse available templates (see [Query Templates](#query-templates) above)
## Exporting Logs
### CSV Export
Export search results to CSV for offline analysis:
1. Apply filters or search query
2. Click **Export to CSV**
3. Download the file
### Log Integration
Forward all logs to external systems:
* **AWS S3**: Long-term archive, compliance storage
* **Datadog**: Real-time monitoring and alerting
* **Splunk**: SIEM integration
See [Log Integration](/docs/guides/integrations/log) for setup instructions.
## Log Retention
### Connector Logs
Connector logs (queries, commands, API calls) are stored in Formal's Quickwit index and are available for as long as your account is active. For long-term archival or compliance requirements, use [Log Integration](/docs/guides/integrations/log) to forward logs to:
* **AWS S3**: Cost-effective long-term storage for compliance (e.g., 7-year SOC 2 retention)
* **Datadog**: Real-time monitoring with configurable retention periods
* **Splunk**: SIEM integration with custom retention policies
### Policy Evaluation Input Retention
Policy evaluation inputs (the `input` data passed to policies) contain sensitive information and have a configurable retention period of **0 to 30 days**. This data powers [policy impact reports](/docs/guides/policies/operations#3-impact-reports-backtesting).
Configure retention at [Log Configurations](https://app.formal.ai/log-configurations) independently for each evaluation stage:
| Stage | What's Retained | Use Case |
| ------------ | ------------------------------------------ | ----------------------------------- |
| **Session** | User, resource, device, connection context | Backtest session-level policies |
| **Request** | Query text, table paths, schema paths | Backtest request policies |
| **Response** | Column data, row counts, data labels | Backtest response masking/filtering |
Retention can be scoped at multiple levels (in precedence order):
1. **Resource** — per-resource override
2. **Connector** — per-connector default
3. **Space** — per-space default
4. **Account** — organization-wide default
Setting retention to **0 days** disables retention for that stage. Policy
impact reports won't have data to backtest against for disabled stages.
Changes to retention settings may take up to a day to take effect.
Policy evaluation inputs may contain sensitive data depending on your
policies. Retention is subject to a maximum of 30 days. Changing retention
settings may take a day to take effect.
## Best Practices
Save frequently used searches for compliance, security, or operational
monitoring.
Forward logs to your SIEM or data lake for advanced analytics and long-term
retention beyond Formal's console.
Schedule weekly or monthly log reviews to identify unusual patterns, policy
gaps, or security incidents.
Leverage aggregation and visualization to spot trends that aren't obvious in
individual log entries.
Regularly review logs where policies blocked or masked data to ensure
policies are working as intended.
## Policy Evaluation Input Retention
Formal can optionally retain the `input` data passed to policies during evaluation. This enables [policy backtesting](/docs/guides/policies/operations#3-impact-reports-backtesting) — testing new or modified policies against historical access patterns. Refer to [policies evaluation docs](/docs/guides/policies/evaluation#policy-stages) for what is available as input at each stage.
See [Log Retention](#log-retention) above for configuration details, scope hierarchy, and retention limits.
## Integration with Policies
Policies can enrich logs with contextual information:
```rego theme={null}
package formal.v2
import future.keywords.if
response := {
"action": "allow",
"reason": "Query approved for analytics team",
"contextual_data": sprintf(
"Approved query on %s by %s from %s",
[input.resource.name, input.user.email, input.client_ip_address]
)
} if {
"analytics" in input.user.groups
}
```
The `reason` and `contextual_data` fields appear in the log entry, providing audit trail context.
## Next Steps
View active and completed sessions
Forward logs to your SIEM
Access your queries by clicking **Queries** in the toolbar. The Query Library provides three tabs:
### Recent Queries
View your search history:
1. Click **Queries** to open the Query Library
2. View the **Recent** tab (default)
3. Select any previous query to re-run it
4. History persists across sessions
### Saved Queries
Save frequently used queries for quick access:
1. Create your query with filters or search terms
2. Click **Save** in the toolbar
3. Name your query
4. Access later from **Queries** → **Saved** tab
### Template Queries
Pre-built queries for common use cases. Click **Queries** → **Templates** to browse available templates (see [Query Templates](#query-templates) above)
## Exporting Logs
### CSV Export
Export search results to CSV for offline analysis:
1. Apply filters or search query
2. Click **Export to CSV**
3. Download the file
### Log Integration
Forward all logs to external systems:
* **AWS S3**: Long-term archive, compliance storage
* **Datadog**: Real-time monitoring and alerting
* **Splunk**: SIEM integration
See [Log Integration](/docs/guides/integrations/log) for setup instructions.
## Log Retention
### Connector Logs
Connector logs (queries, commands, API calls) are stored in Formal's Quickwit index and are available for as long as your account is active. For long-term archival or compliance requirements, use [Log Integration](/docs/guides/integrations/log) to forward logs to:
* **AWS S3**: Cost-effective long-term storage for compliance (e.g., 7-year SOC 2 retention)
* **Datadog**: Real-time monitoring with configurable retention periods
* **Splunk**: SIEM integration with custom retention policies
### Policy Evaluation Input Retention
Policy evaluation inputs (the `input` data passed to policies) contain sensitive information and have a configurable retention period of **0 to 30 days**. This data powers [policy impact reports](/docs/guides/policies/operations#3-impact-reports-backtesting).
Configure retention at [Log Configurations](https://app.formal.ai/log-configurations) independently for each evaluation stage:
| Stage | What's Retained | Use Case |
| ------------ | ------------------------------------------ | ----------------------------------- |
| **Session** | User, resource, device, connection context | Backtest session-level policies |
| **Request** | Query text, table paths, schema paths | Backtest request policies |
| **Response** | Column data, row counts, data labels | Backtest response masking/filtering |
Retention can be scoped at multiple levels (in precedence order):
1. **Resource** — per-resource override
2. **Connector** — per-connector default
3. **Space** — per-space default
4. **Account** — organization-wide default
Setting retention to **0 days** disables retention for that stage. Policy
impact reports won't have data to backtest against for disabled stages.
Changes to retention settings may take up to a day to take effect.
Policy evaluation inputs may contain sensitive data depending on your
policies. Retention is subject to a maximum of 30 days. Changing retention
settings may take a day to take effect.
## Best Practices
Save frequently used searches for compliance, security, or operational
monitoring.
Forward logs to your SIEM or data lake for advanced analytics and long-term
retention beyond Formal's console.
Schedule weekly or monthly log reviews to identify unusual patterns, policy
gaps, or security incidents.
Leverage aggregation and visualization to spot trends that aren't obvious in
individual log entries.
Regularly review logs where policies blocked or masked data to ensure
policies are working as intended.
## Policy Evaluation Input Retention
Formal can optionally retain the `input` data passed to policies during evaluation. This enables [policy backtesting](/docs/guides/policies/operations#3-impact-reports-backtesting) — testing new or modified policies against historical access patterns. Refer to [policies evaluation docs](/docs/guides/policies/evaluation#policy-stages) for what is available as input at each stage.
See [Log Retention](#log-retention) above for configuration details, scope hierarchy, and retention limits.
## Integration with Policies
Policies can enrich logs with contextual information:
```rego theme={null}
package formal.v2
import future.keywords.if
response := {
"action": "allow",
"reason": "Query approved for analytics team",
"contextual_data": sprintf(
"Approved query on %s by %s from %s",
[input.resource.name, input.user.email, input.client_ip_address]
)
} if {
"analytics" in input.user.groups
}
```
The `reason` and `contextual_data` fields appear in the log entry, providing audit trail context.
## Next Steps
View active and completed sessions
Forward logs to your SIEM