> ## Documentation Index
> Fetch the complete documentation index at: https://docs.formal.ai/llms.txt
> Use this file to discover all available pages before exploring further.
# Health
> How to gain observability into your Connector instances
Your Formal Connector deployment will require different resource requirements depending on the specifics of your setup. Factors like the number of active connections you expect to pass through the Connector at once, the policies you configure, the payload sizes of requests and responses, and more can affect the health of individual Connector instances.
There are two ways we help our customers get observability into their Connectors: **Logs** and **Metrics**.
## Logs
The Connector emits logs to stdout/stderr that can be captured in your log collector of choice.
For example, if deploying your [Connector on ECS Fargate using Terraform](https://github.com/formalco/terraform-provider-formal/blob/21a509320e912921700dda2269eae2629b5db49e/examples/deployments/aws/postgres/internal/postgres_proxy/ecs.tf#L69), use `logConfiguration` to route these logs to be sent to your observability tool of choice:
```hcl theme={null}
resource "aws_ecs_task_definition" "ecs_task" {
# ignoring other fields irrelevant to logs in this example
container_definitions = jsonencode([
{
name = var.name
image = var.container_image
essential = true
environment = [
{
name = "DD_VERSION"
value = "1.0.0"
},
{
name = "DD_ENV",
value = "prod"
},
{
name = "DD_SERVICE"
value = var.name
},
# specify other env vars here
],
logConfiguration = {
logDriver = "awsfirelens"
options = {
"Name" = "datadog",
"Host" = "http-intake.logs.datadoghq.eu",
"TLS" = "on",
"dd_source" = var.name,
"provider" = "ecs",
"dd_service" = var.name,
"apikey" = var.datadog_api_key
}
}
dependsOn = [
{ "containerName" : "log_router", "condition" : "START" },
{ "condition" = "HEALTHY", "containerName" = "datadog-agent" }
]
},
{
name = "log_router"
image = "public.ecr.aws/aws-observability/aws-for-fluent-bit:stable"
memoryReservation = 50,
firelensConfiguration = {
"type" = "fluentbit",
"options" = {
"enable-ecs-log-metadata" = "true"
}
},
},
{
name = "datadog-agent",
image = "public.ecr.aws/datadog/agent:latest",
portMappings = [
{
"containerPort" = 8126,
"hostPort" = 8126,
"protocol" = "tcp"
}
{
# We need this for metrics
"containerPort" = 4317,
"hostPort" = 4317,
"protocol" = "tcp"
}
],
environment = [{
"name" = "ECS_FARGATE",
"value" = "true"
},
{
"name" = "DD_APM_ENABLED",
"value" = "true"
},
{
"name" = "DD_LOGS_ENABLED",
"value" = "true"
},
{
"name" = "DD_LOGS_CONFIG_CONTAINER_COLLECT_ALL",
"value" = "true"
},
{
"name" = "DD_APM_NON_LOCAL_TRAFFIC",
"value" = "true"
},
{
"name" = "DD_API_KEY",
"value" = var.datadog_api_key
},
{
"name" = "DD_SITE",
"value" = "datadoghq.eu"
}]
}
])
}
```
## Metrics
The Connector emits metrics over [OTLP/gRPC](https://opentelemetry.io/docs/specs/otlp/) to an OpenTelemetry Collector such as [the Datadog Agent](https://docs.datadoghq.com/opentelemetry/setup/agent/) to [127.0.0.1 port 4317](https://opentelemetry.io/docs/specs/otlp/#otlpgrpc-default-port) by default. This endpoint can be customized via connector configuration settings. The Connector currently emits the following metrics:
* `formal.connector.instance.heartbeat`: A heartbeat gauge metric once every 30 seconds to verify Connector instance uptime.
* `formal.connector.memory.usage_percent`: A memory usage percentage gauge metric based on the connector's runtime memory allotment. Note that these percentages may look different than the host's memory usage if the memory allotted to the Connector is less than the overall host.
* `formal.connector.connections_opened`: A counter that is incremented every time the instance accepts a new TCP connection from a client.
* `formal.connector.connections_closed`: A counter that is incremented every time the instance closes a TCP connection from a client.
* `formal.connector.active_connections`: A gauge metric of the current number of open TCP client connections that the instance has.
* `formal.control_plane.pings_received`: A counter metric that is incremented every time we receive a ping from the Control Plane.
* `formal.connector.resource_health_check`: A gauge metric of resource health checks.
### Deploying an OpenTelemetry Collector
By default the Connector sends metrics to an OpenTelemetry Collector at `127.0.0.1` port 4317, so a Collector on the same host works out of the box. For this setup, run the Datadog Agent as a container on that host (so it is reachable over 127.0.0.1) and set the `DD_OTLP_CONFIG_RECEIVER_PROTOCOLS_GRPC_ENDPOINT=0.0.0.0:4317` environment variable.
You can also configure the Connector to send metrics to a different hostname and port using the Connector configuration settings, either from the Console or with Terraform. In Terraform, use the `otel_endpoint_hostname` and `otel_endpoint_port` fields in your `formal_connector_configuration` resource to specify a custom OpenTelemetry endpoint. If nothing is listening on the configured endpoint, the Connector will refrain from sending metrics entirely.
**Note:** these metrics are not sent over TLS, so make sure the OpenTelemetry endpoint is in your trusted network.
## Datadog Dashboard
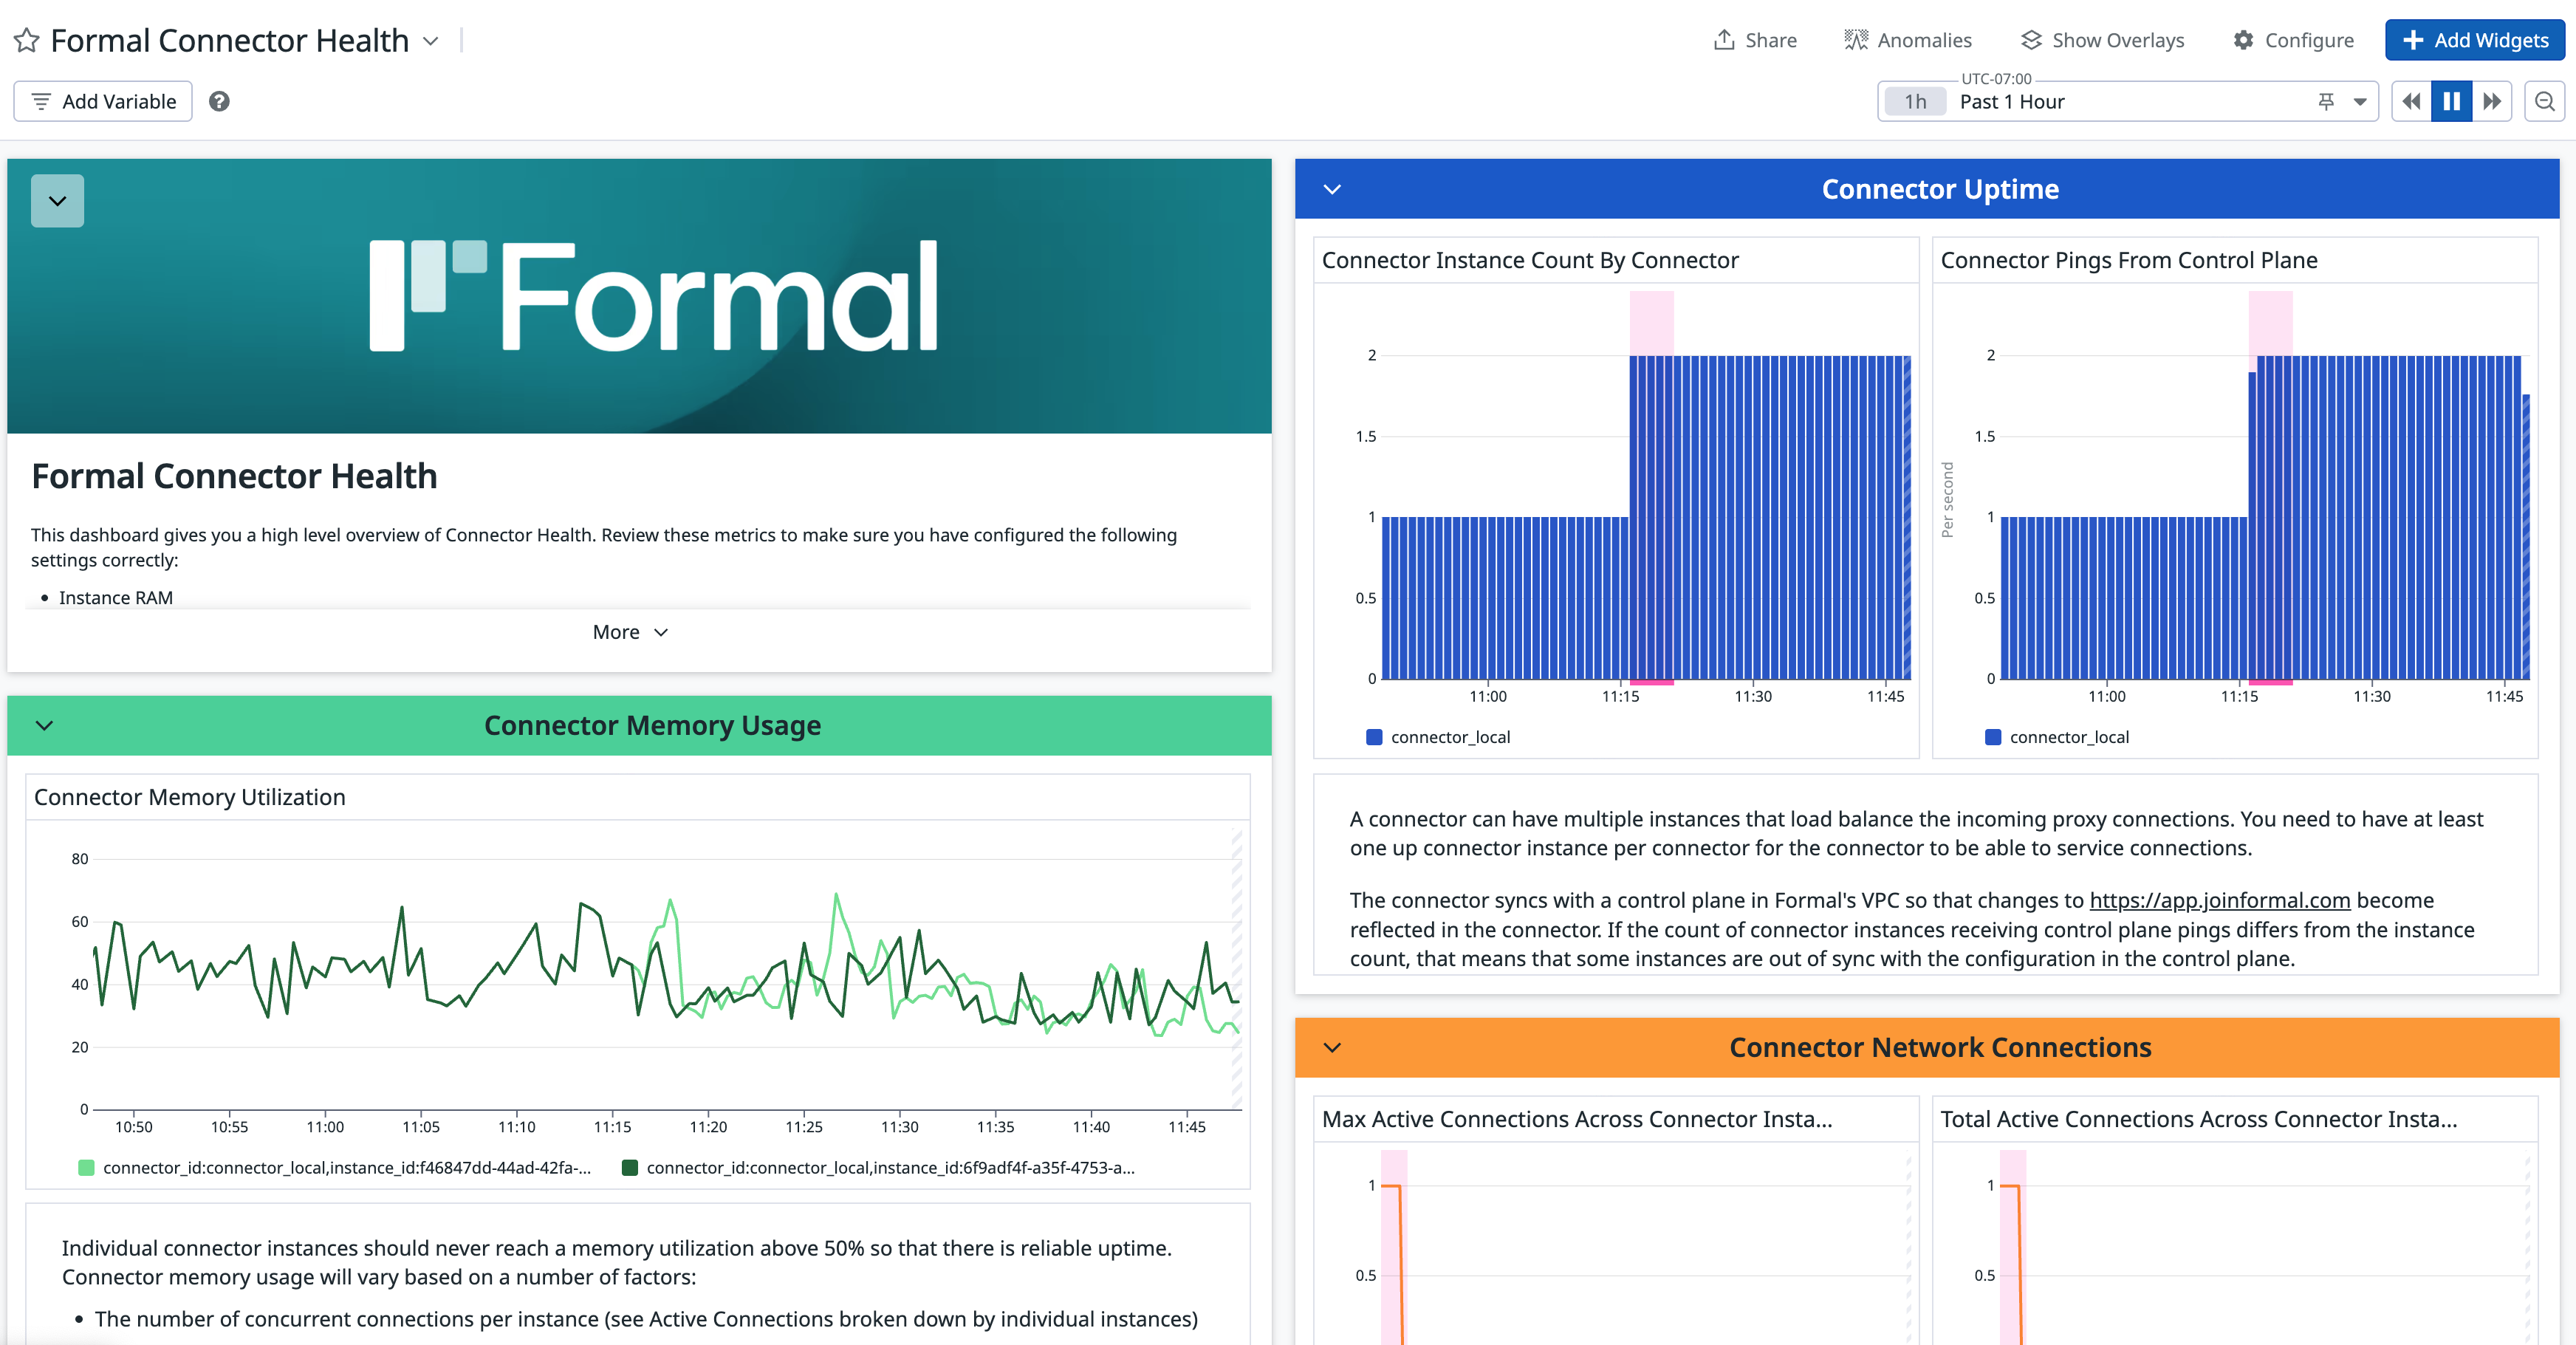
To visualize connector health in a single place, we provide a [template dashboard](/assets/json/connector_health_dashboard_datadog.json) for you to import into your Datadog instance.
 * Download the [template JSON](/assets/json/connector_health_dashboard_datadog.json).
* Sign in to your [Datadog account](https://app.datadoghq.com/).
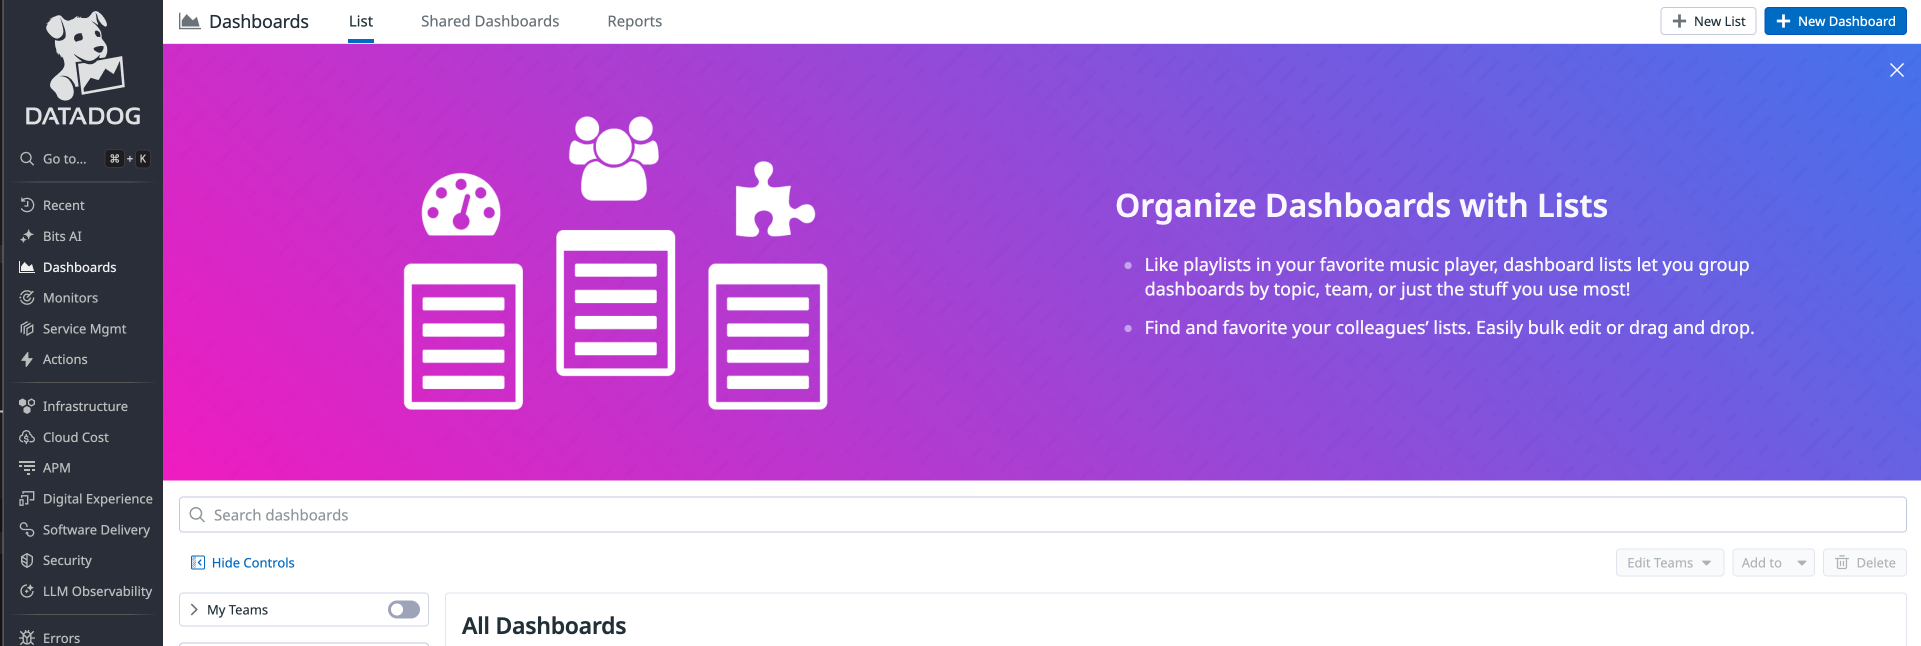
* Navigate to the [Dashboard List](https://app.datadoghq.com/dashboard/lists) page.
* Choose the **+ New Dashboard** button.
* Download the [template JSON](/assets/json/connector_health_dashboard_datadog.json).
* Sign in to your [Datadog account](https://app.datadoghq.com/).
* Navigate to the [Dashboard List](https://app.datadoghq.com/dashboard/lists) page.
* Choose the **+ New Dashboard** button.
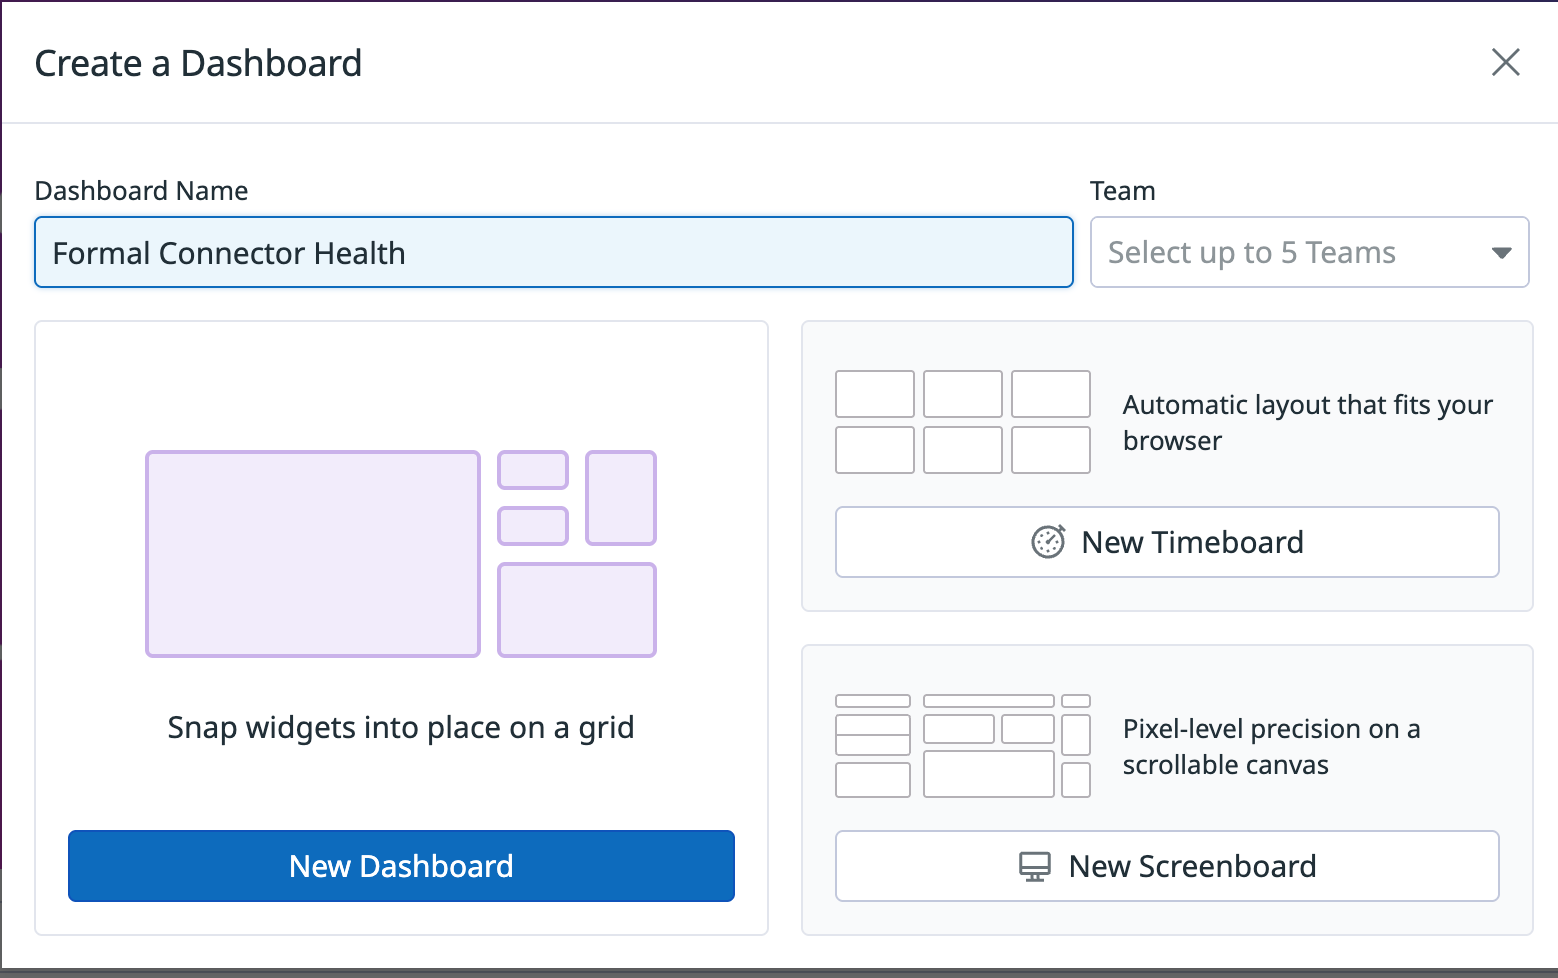
 * Enter a dashboard name.
* Choose the **New Dashboard** button.
* Enter a dashboard name.
* Choose the **New Dashboard** button.
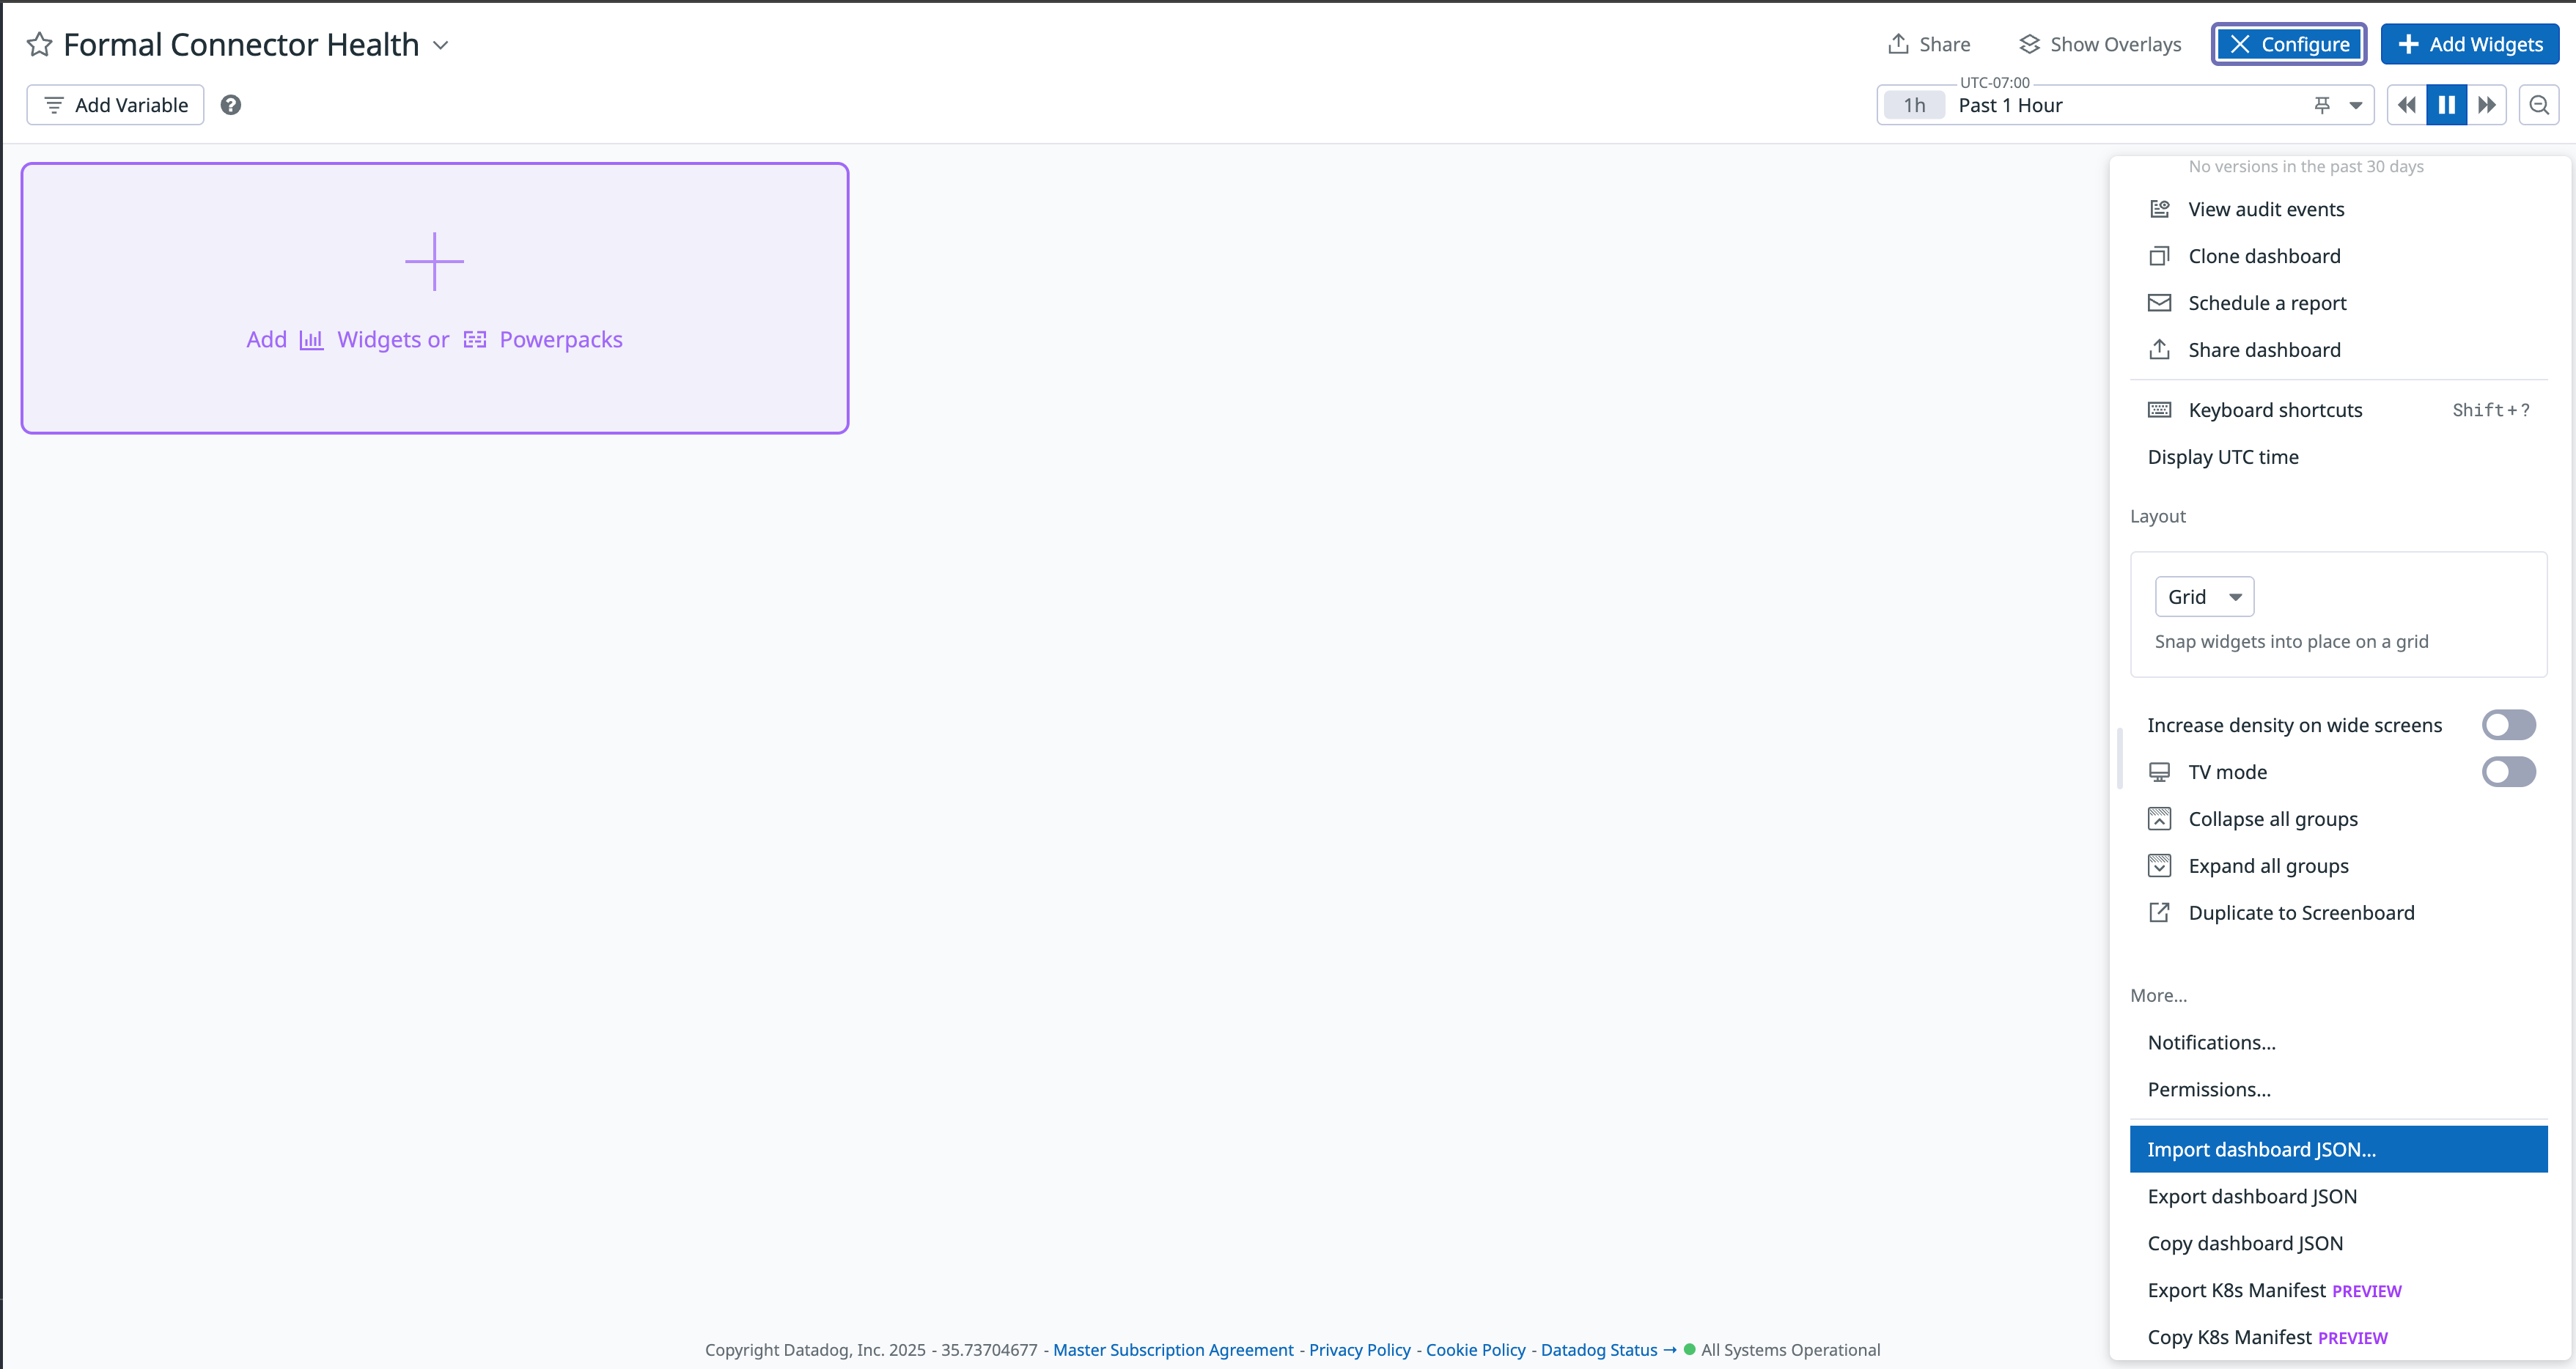
 * In the new dashboard, choose the **Configure** button.
* Choose the **Import dashboard JSON** button.
* In the new dashboard, choose the **Configure** button.
* Choose the **Import dashboard JSON** button.
 * Upload the dashboard JSON file downloaded in the previous steps.
## Grafana Dashboard
If you use Grafana with Prometheus, we provide a [template dashboard](/assets/json/connector_health_dashboard_grafana.json) for you to import into your Grafana instance.
* Upload the dashboard JSON file downloaded in the previous steps.
## Grafana Dashboard
If you use Grafana with Prometheus, we provide a [template dashboard](/assets/json/connector_health_dashboard_grafana.json) for you to import into your Grafana instance.
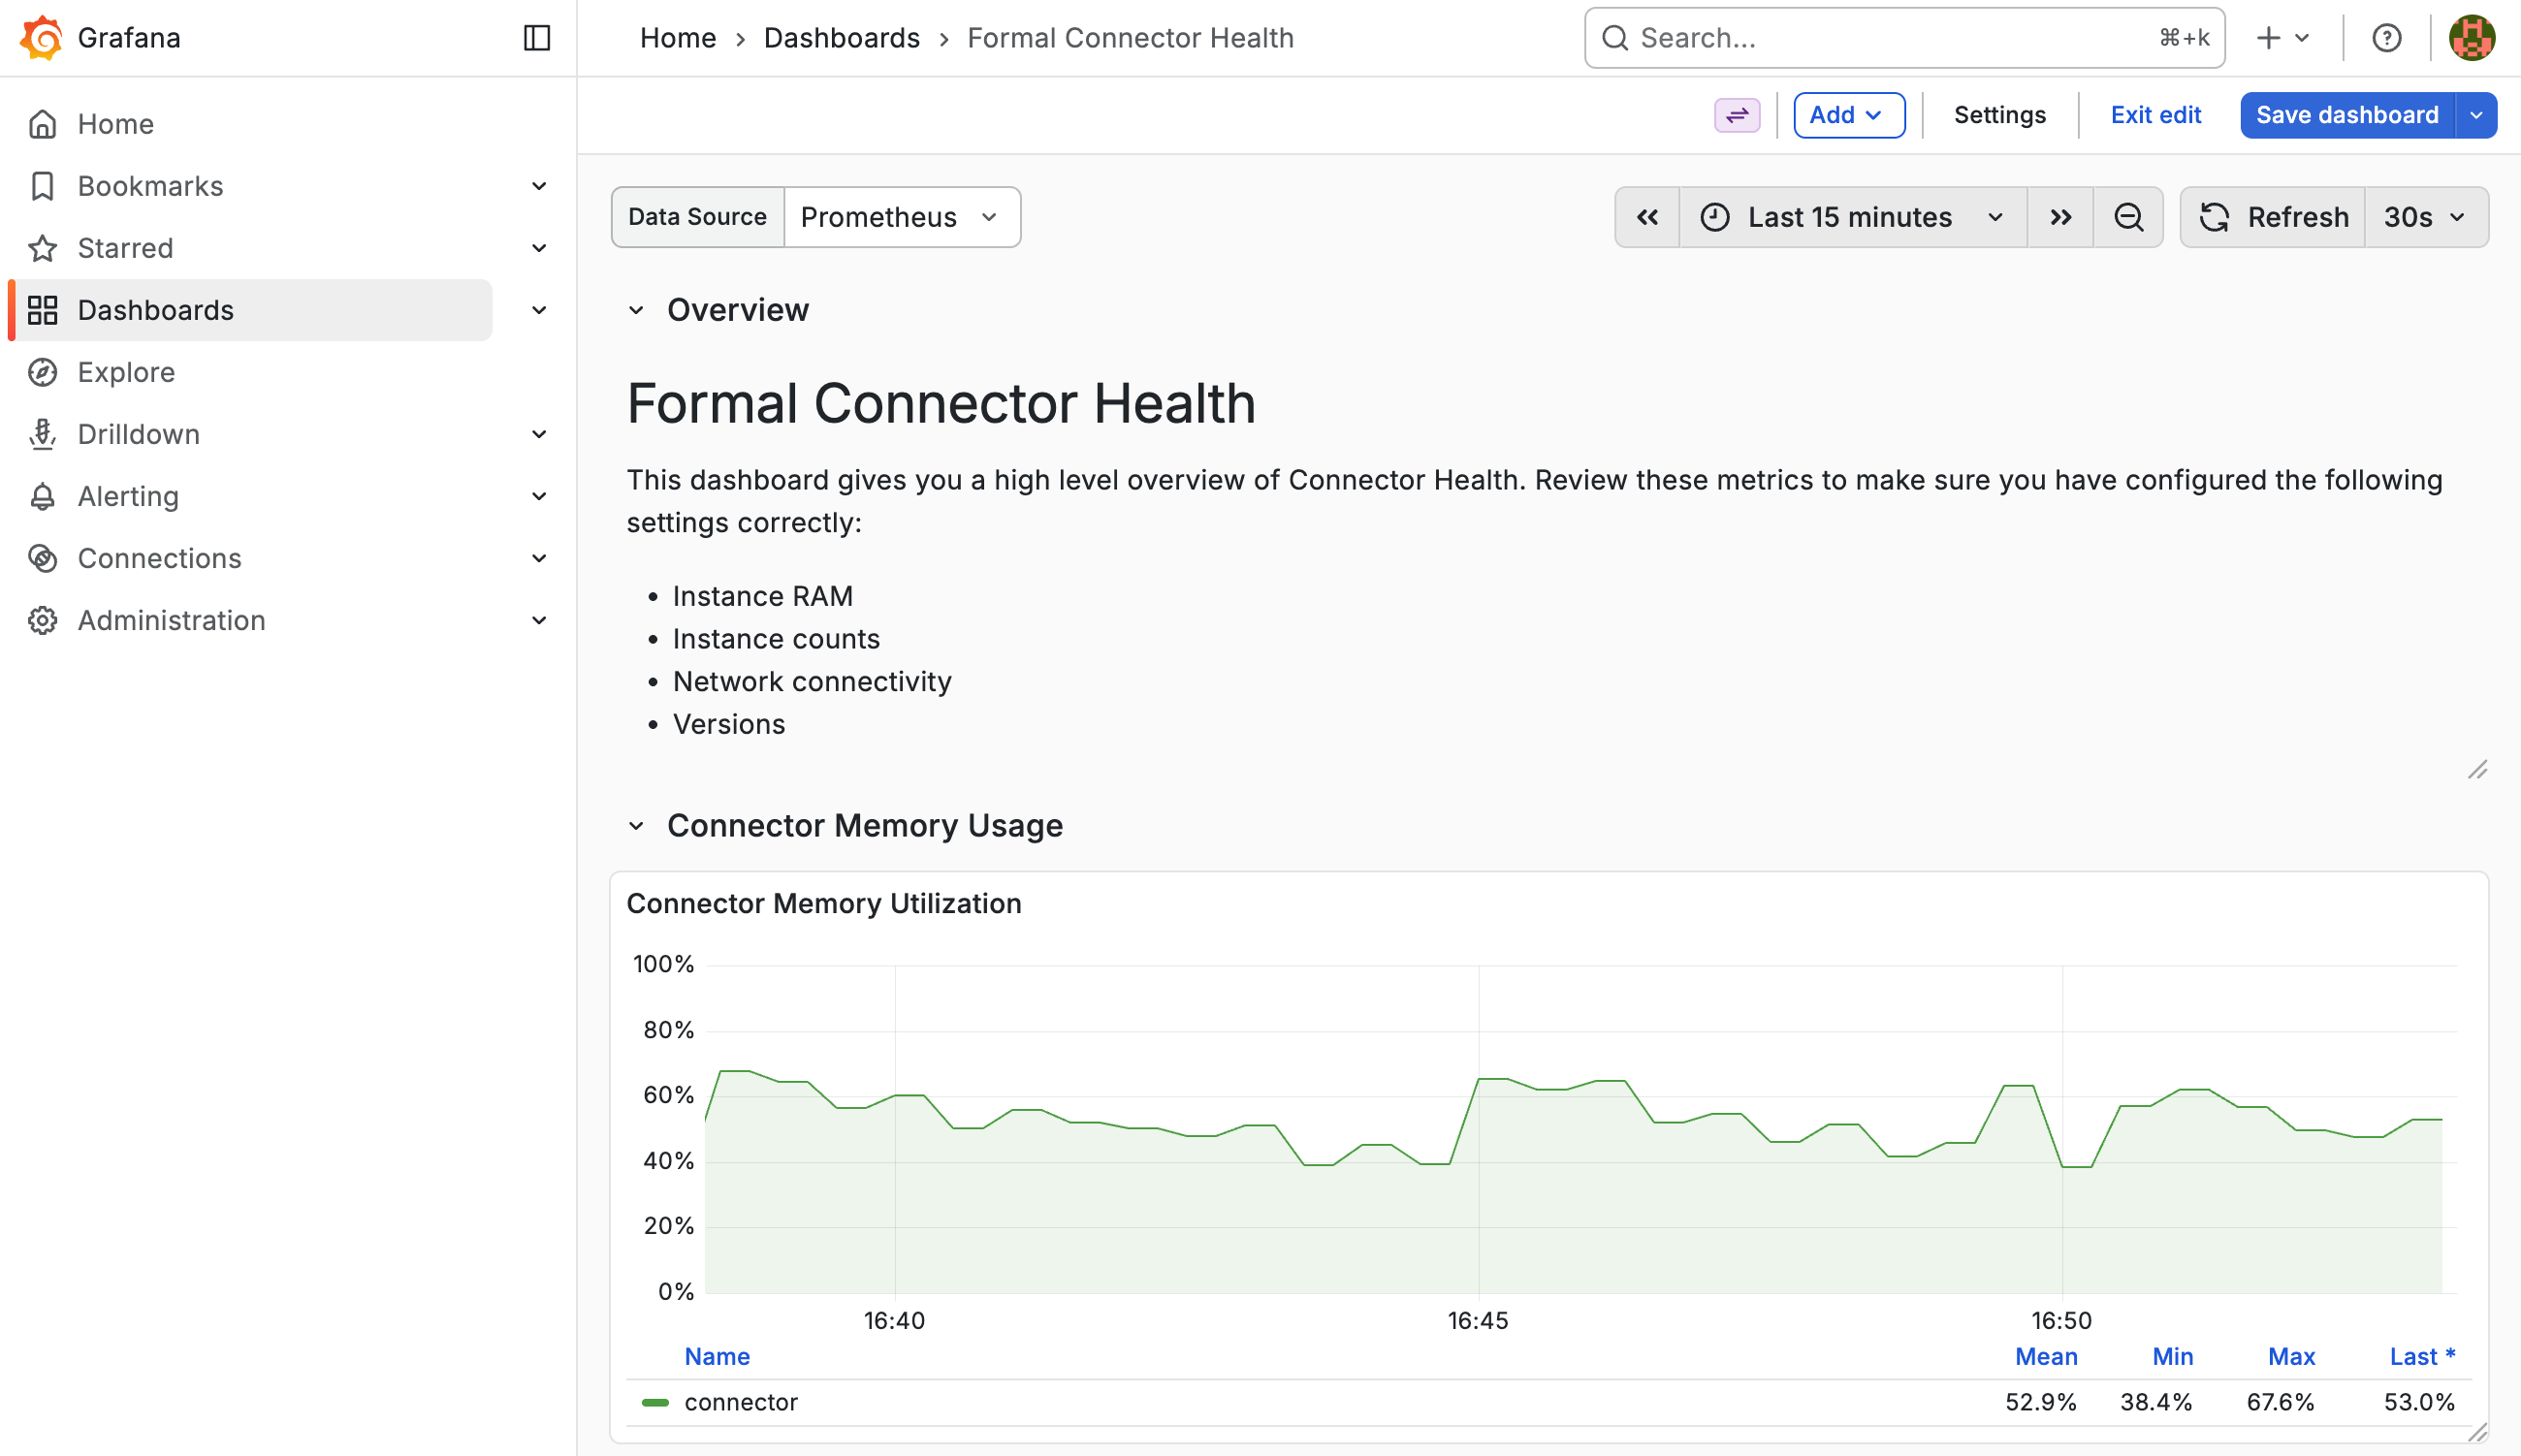 This dashboard expects metrics to be collected via an [OpenTelemetry Collector](https://opentelemetry.io/docs/collector/) configured with a Prometheus exporter, which Prometheus then scrapes.
* Download the [template JSON](/assets/json/connector_health_dashboard_grafana.json).
* Sign in to your Grafana instance.
* Navigate to **Dashboards** in the side menu.
* Choose the **New** button, then **Import**.
* Upload the dashboard JSON file or paste its contents.
* Select your Prometheus data source when prompted.
* Choose **Import**.
This dashboard expects metrics to be collected via an [OpenTelemetry Collector](https://opentelemetry.io/docs/collector/) configured with a Prometheus exporter, which Prometheus then scrapes.
* Download the [template JSON](/assets/json/connector_health_dashboard_grafana.json).
* Sign in to your Grafana instance.
* Navigate to **Dashboards** in the side menu.
* Choose the **New** button, then **Import**.
* Upload the dashboard JSON file or paste its contents.
* Select your Prometheus data source when prompted.
* Choose **Import**.